Get a free demo to test the world’s largest tank terminal online database
In 30 minutes, you will learn about the 5 data categories that are essential to companies that are part of the Oil & Gas Midstream sector, which we describe on this page.
- Infrastructural Data: storage capacity, number of tanks, tank types/ranges, stored products, detailed access modes, terminal status (captive, independent, existing, under expansion and more).
- Logistical Data: Transport operator info of not only the truck, rail, and pipeline companies connected to facilities, but also the areas of activity throughout which they deliver their services.
- Operational Data: Analysis of sea/river facilities' import/export product flows, berth occupancy, maritime gross trade, ship visits/duration, and annualized tank turns.
- Shipping Data: Ships charging/discharging liquid products and the terminals that they previously visited, displayed on a live map that only shows liquid bulk cargo ships.
- Manager-Level Contact Details: Names, phones and emails of general, Commercial and Terminal Managers.
9,750
Tank termminals
732
Petroleum refineries
2,560
Chemical plants
850
Renewable fuel plants
714
Vegetable oil plants
300
Hydrogen
239
Olefin plants
155
Gas storage terminals

Analyze Midstream Data

Make Better Decisions

See How Below
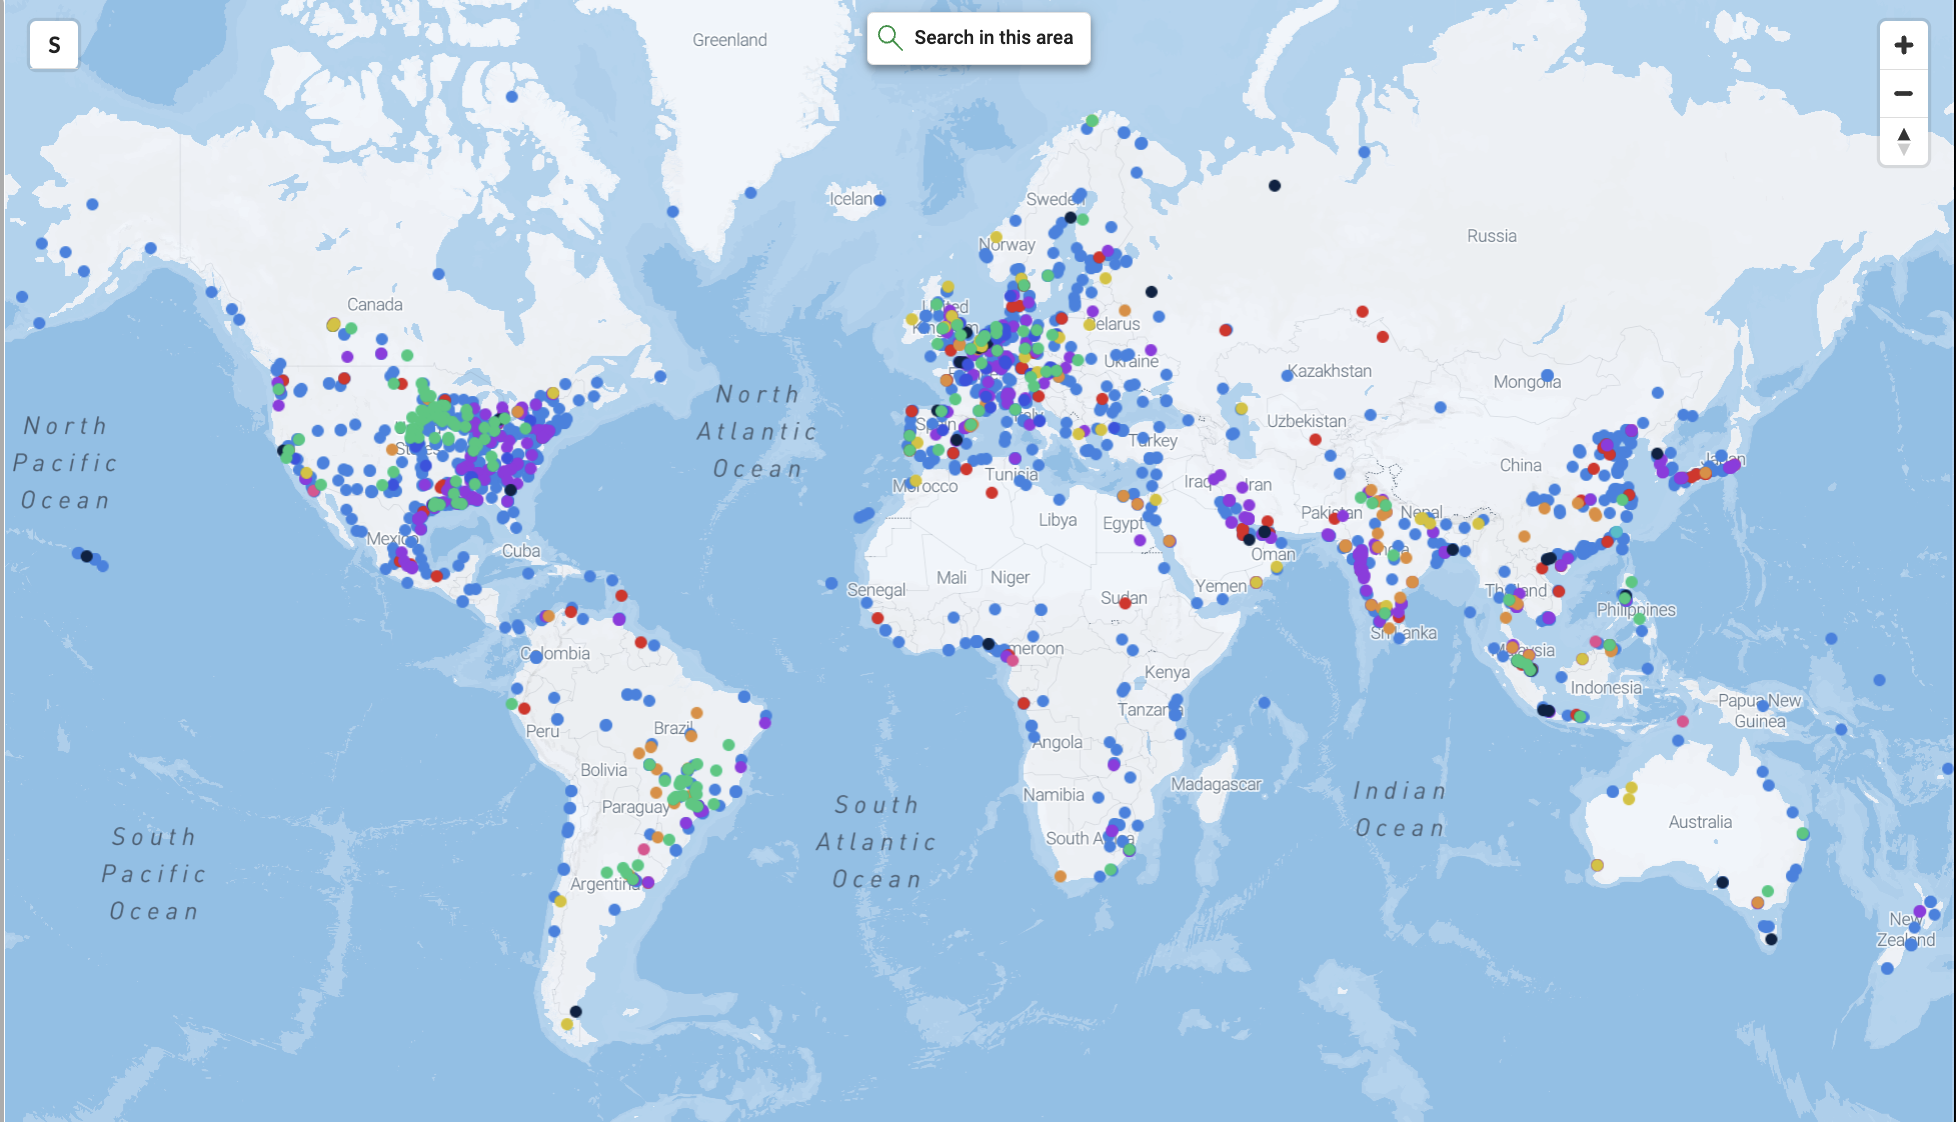
1) One map view, +16,000 terminals & production facilities
Select the facilities you need to analyze by filtering based on different criteria such as location, facility type, tank type, cargo, access type, and terminal status, or search by storage capacity ranges (m3 or bbls), or sea access characteristics (draft, width, length).
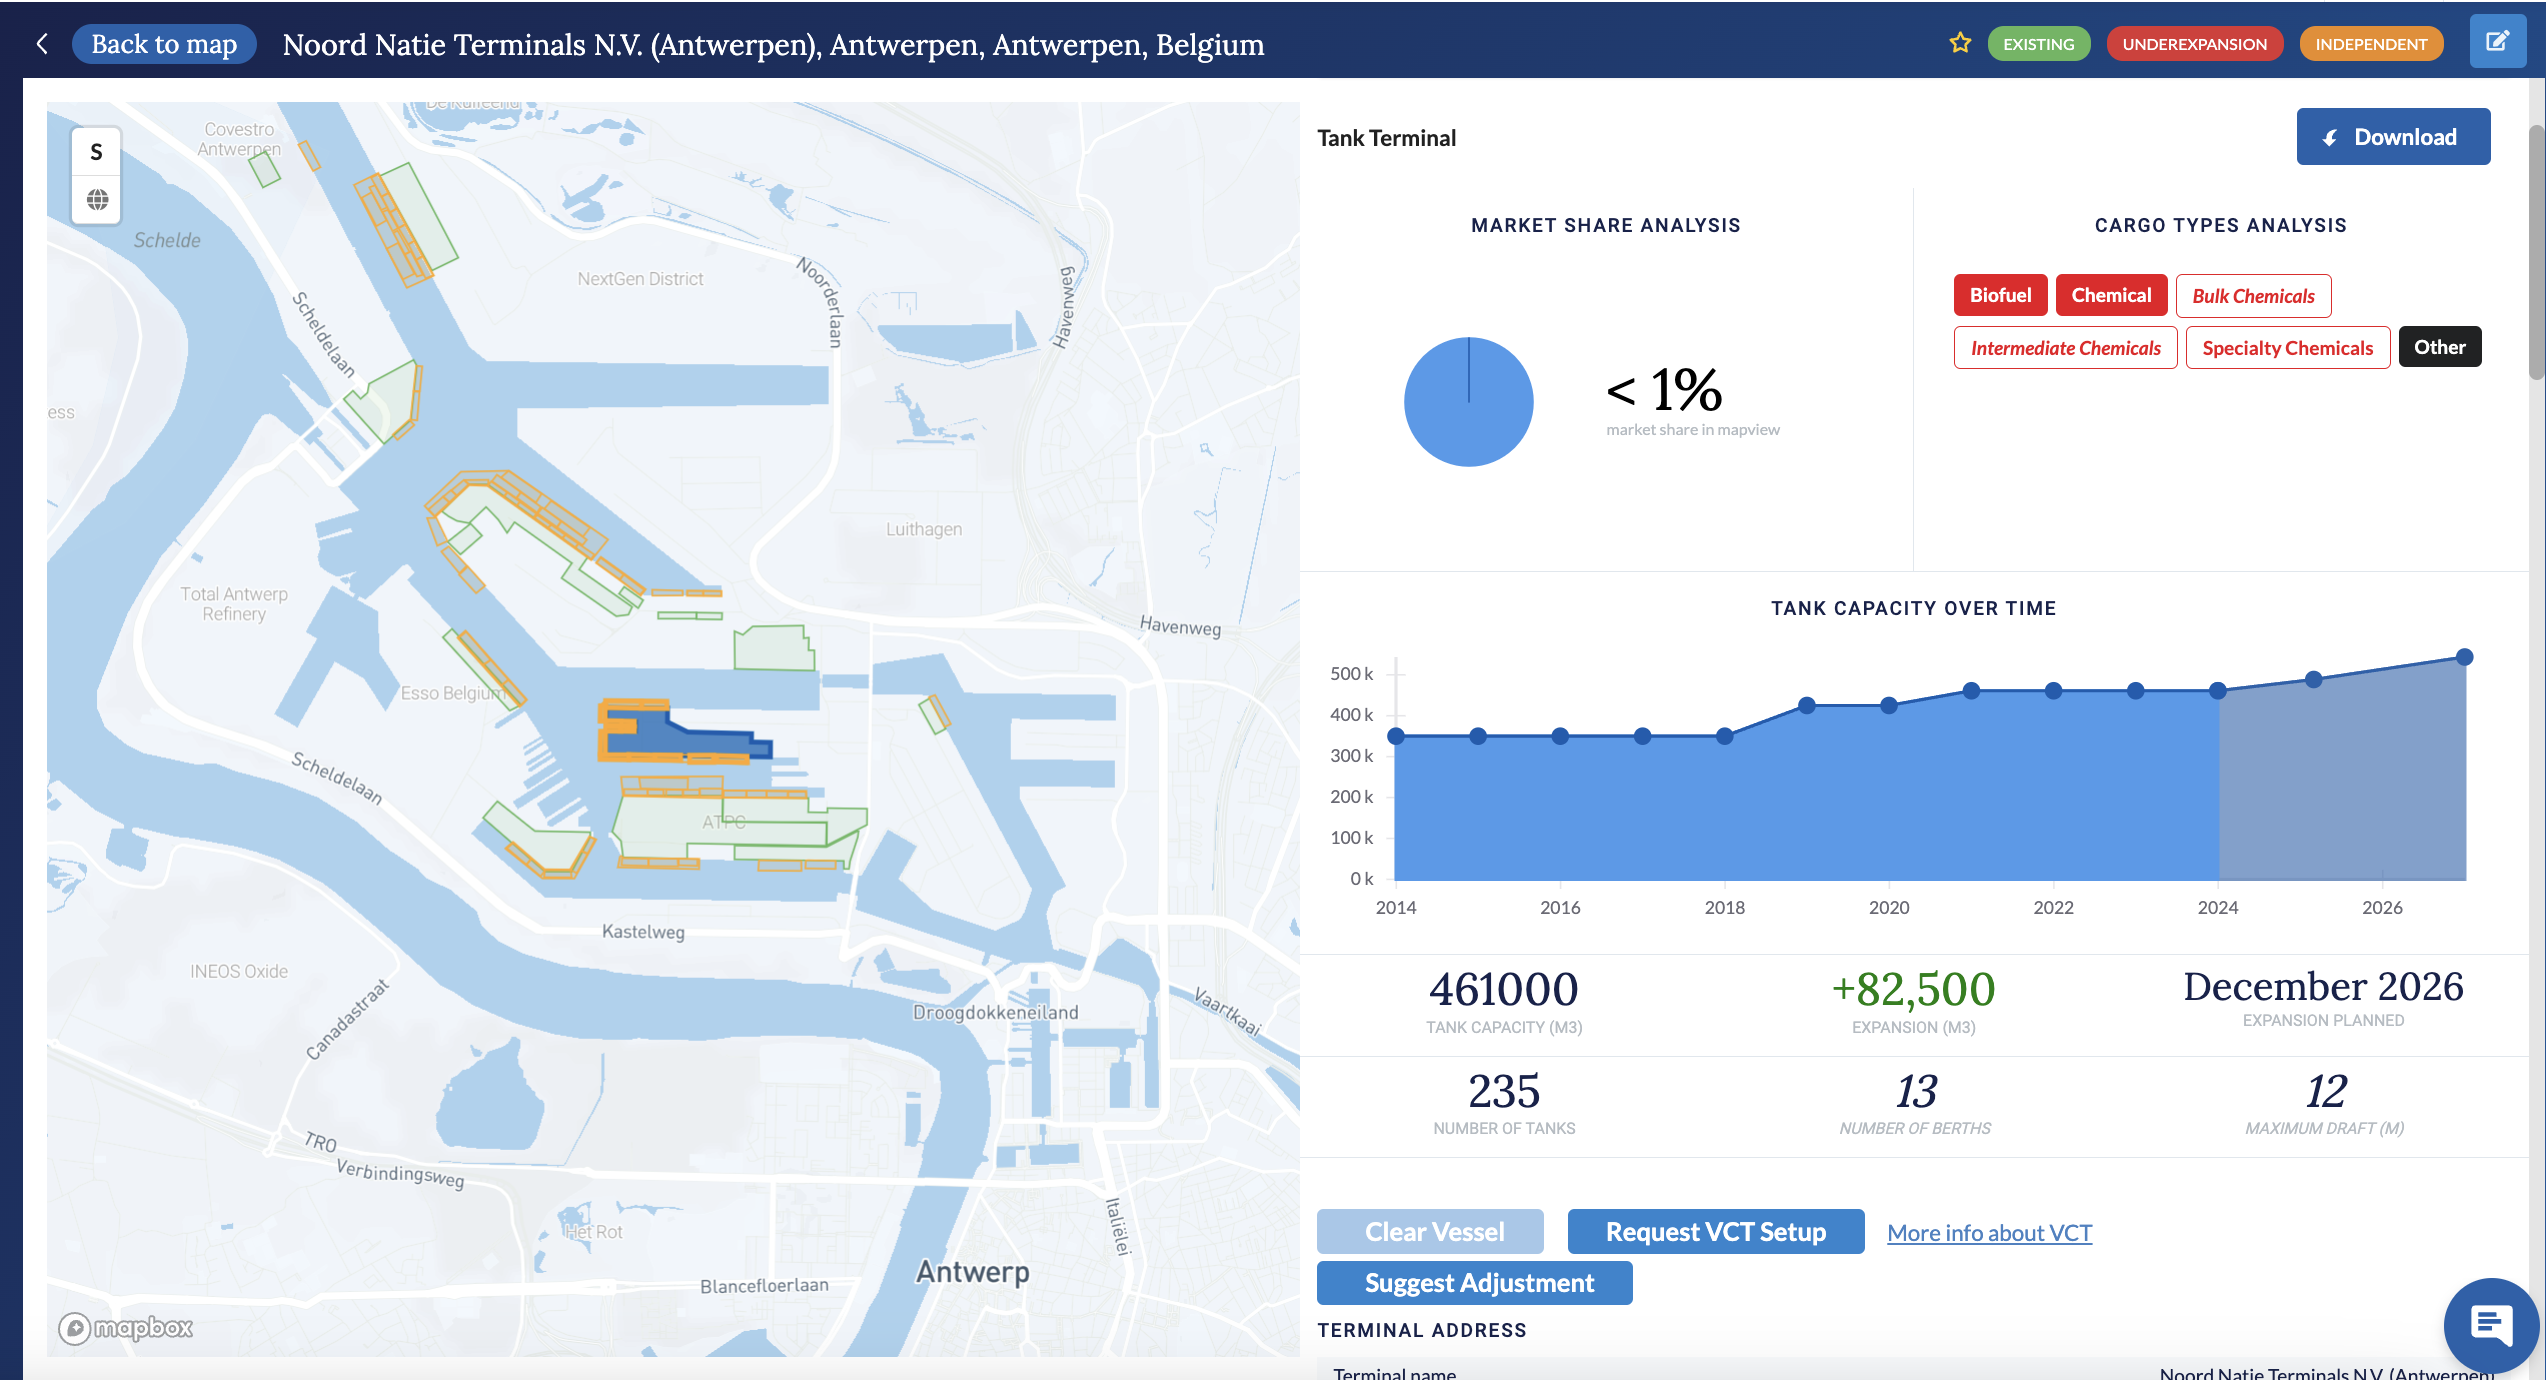
2) Tank terminals and refineries' infrastructural characteristics
Eliminate time-consuming work when searching for terminals’ infrastructural characteristics, we centralize the following data labels per terminal: tank capacity, number of tanks, tank ranges, stations, tracks, wagons, jetties, future capacity, max draft, length, width and DWT, terminals’ status (existing, under expansion, under construction), manager-level contact details (name, last name, phone and email), and more.
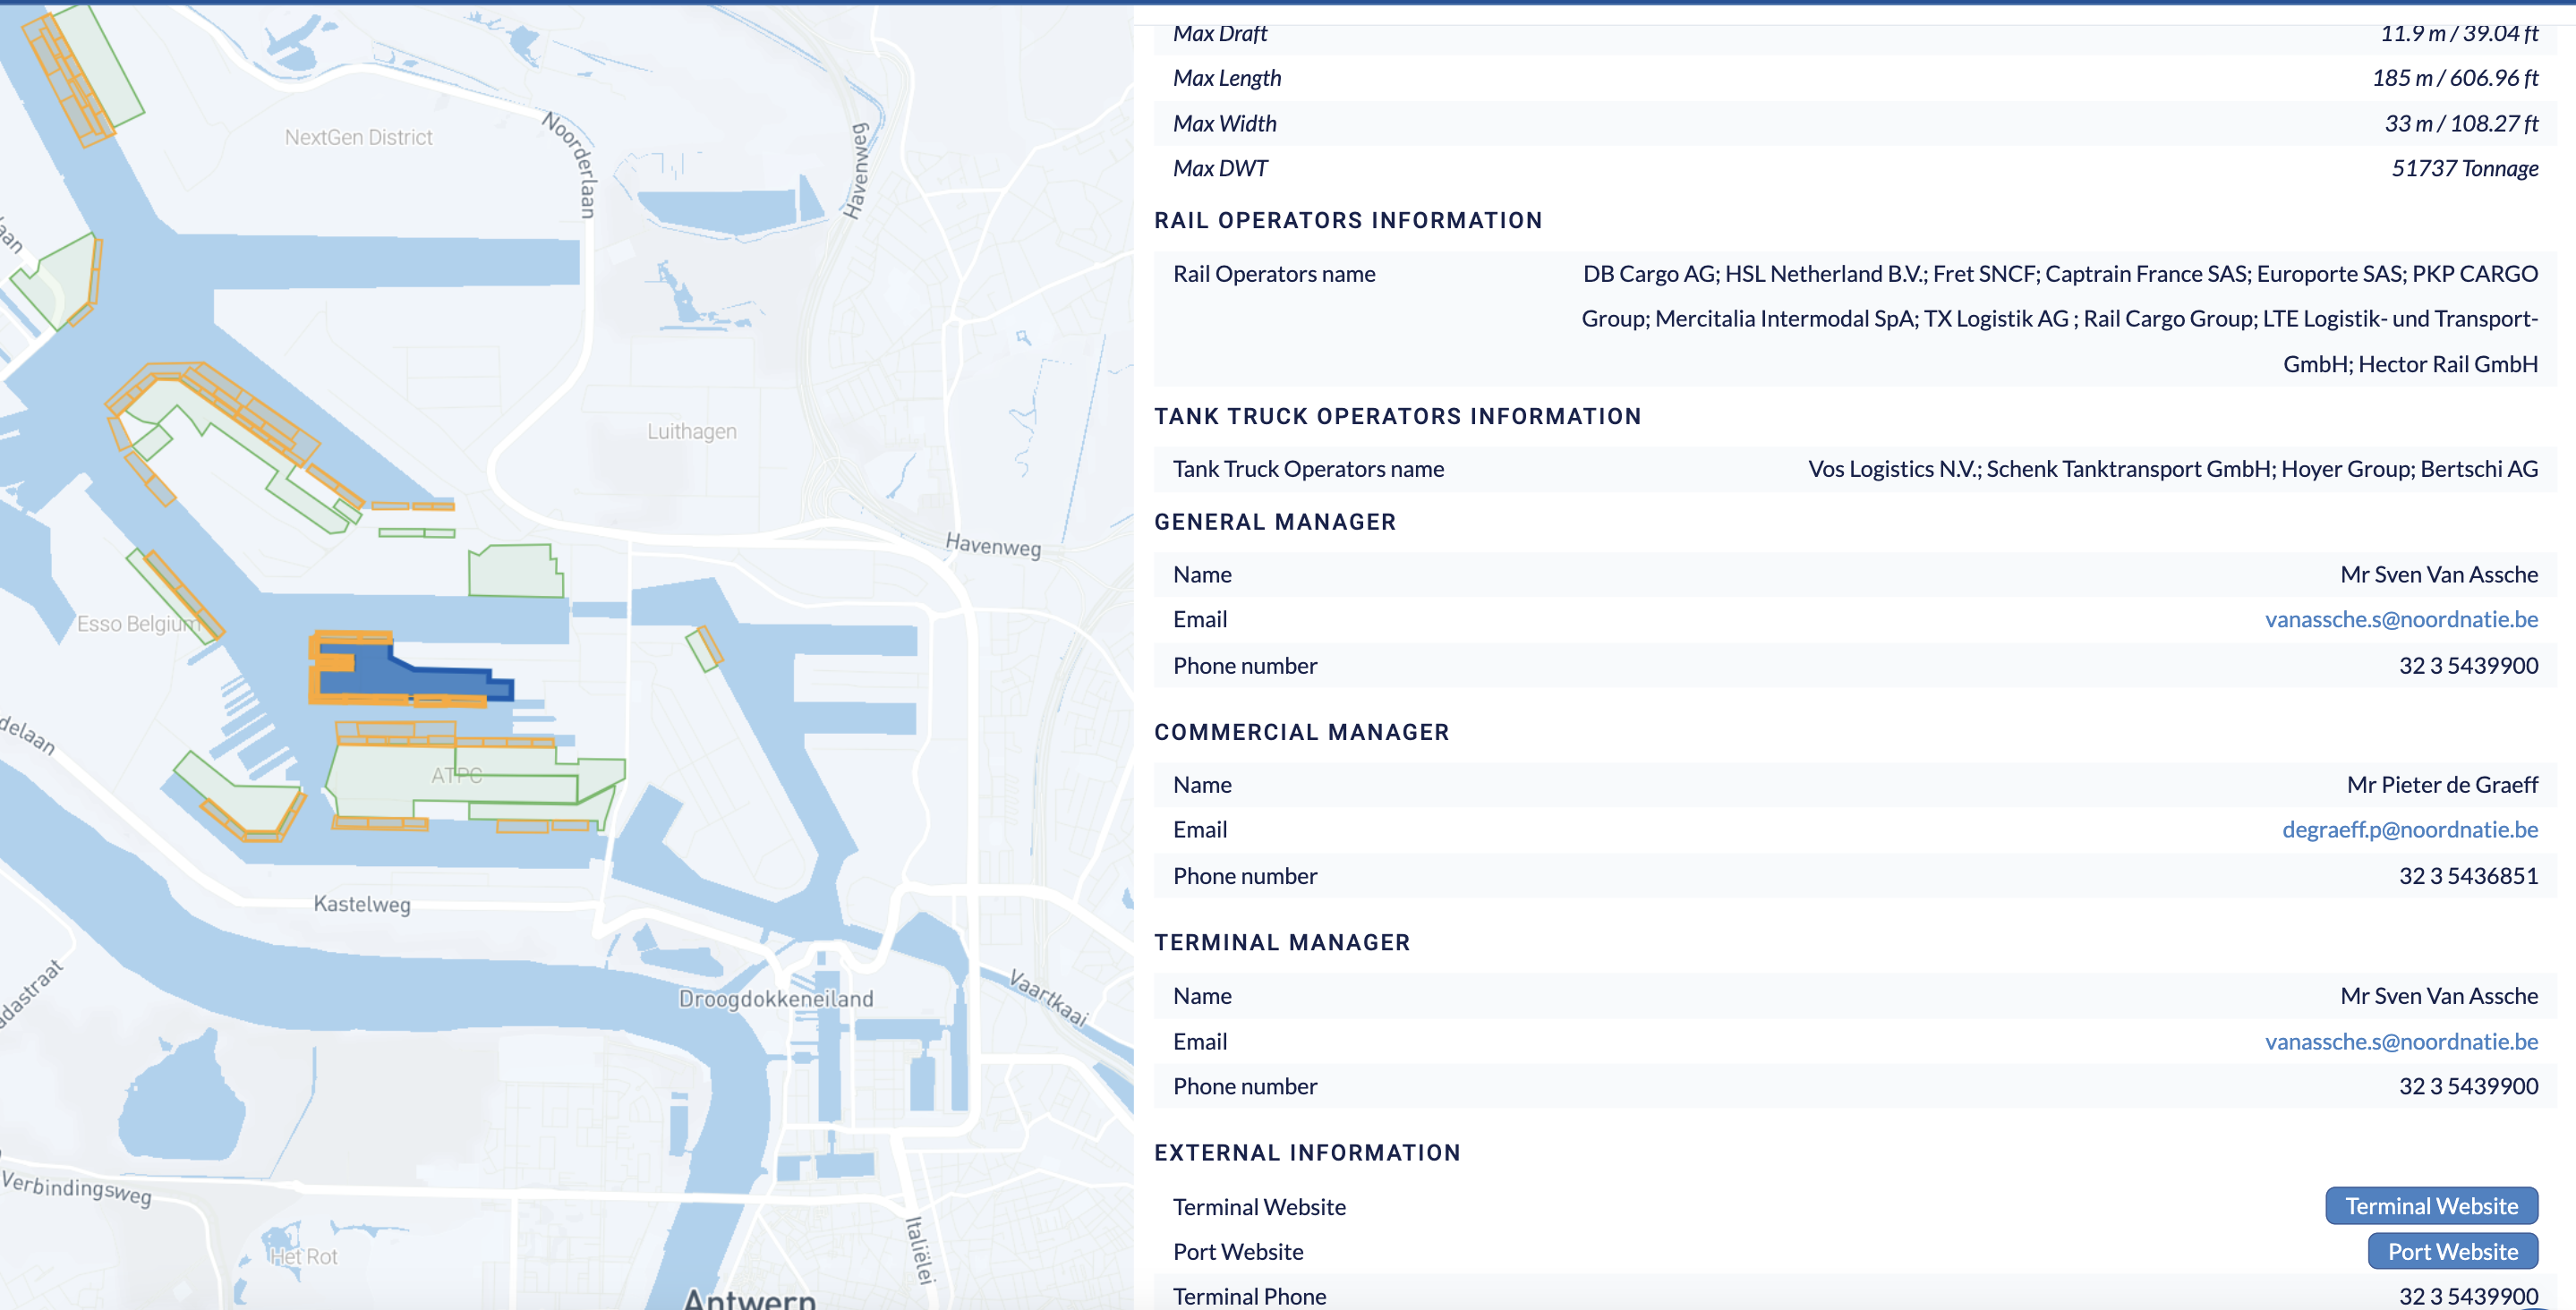
3) Ready-for-Contact details of General, Commercial and Terminal Managers
Accelerate your sales-prospecting actions by reaching out to potential buyers thanks to our ‘Terminal Data Sheets’ that include names, phones and emails of manager-level personnel.
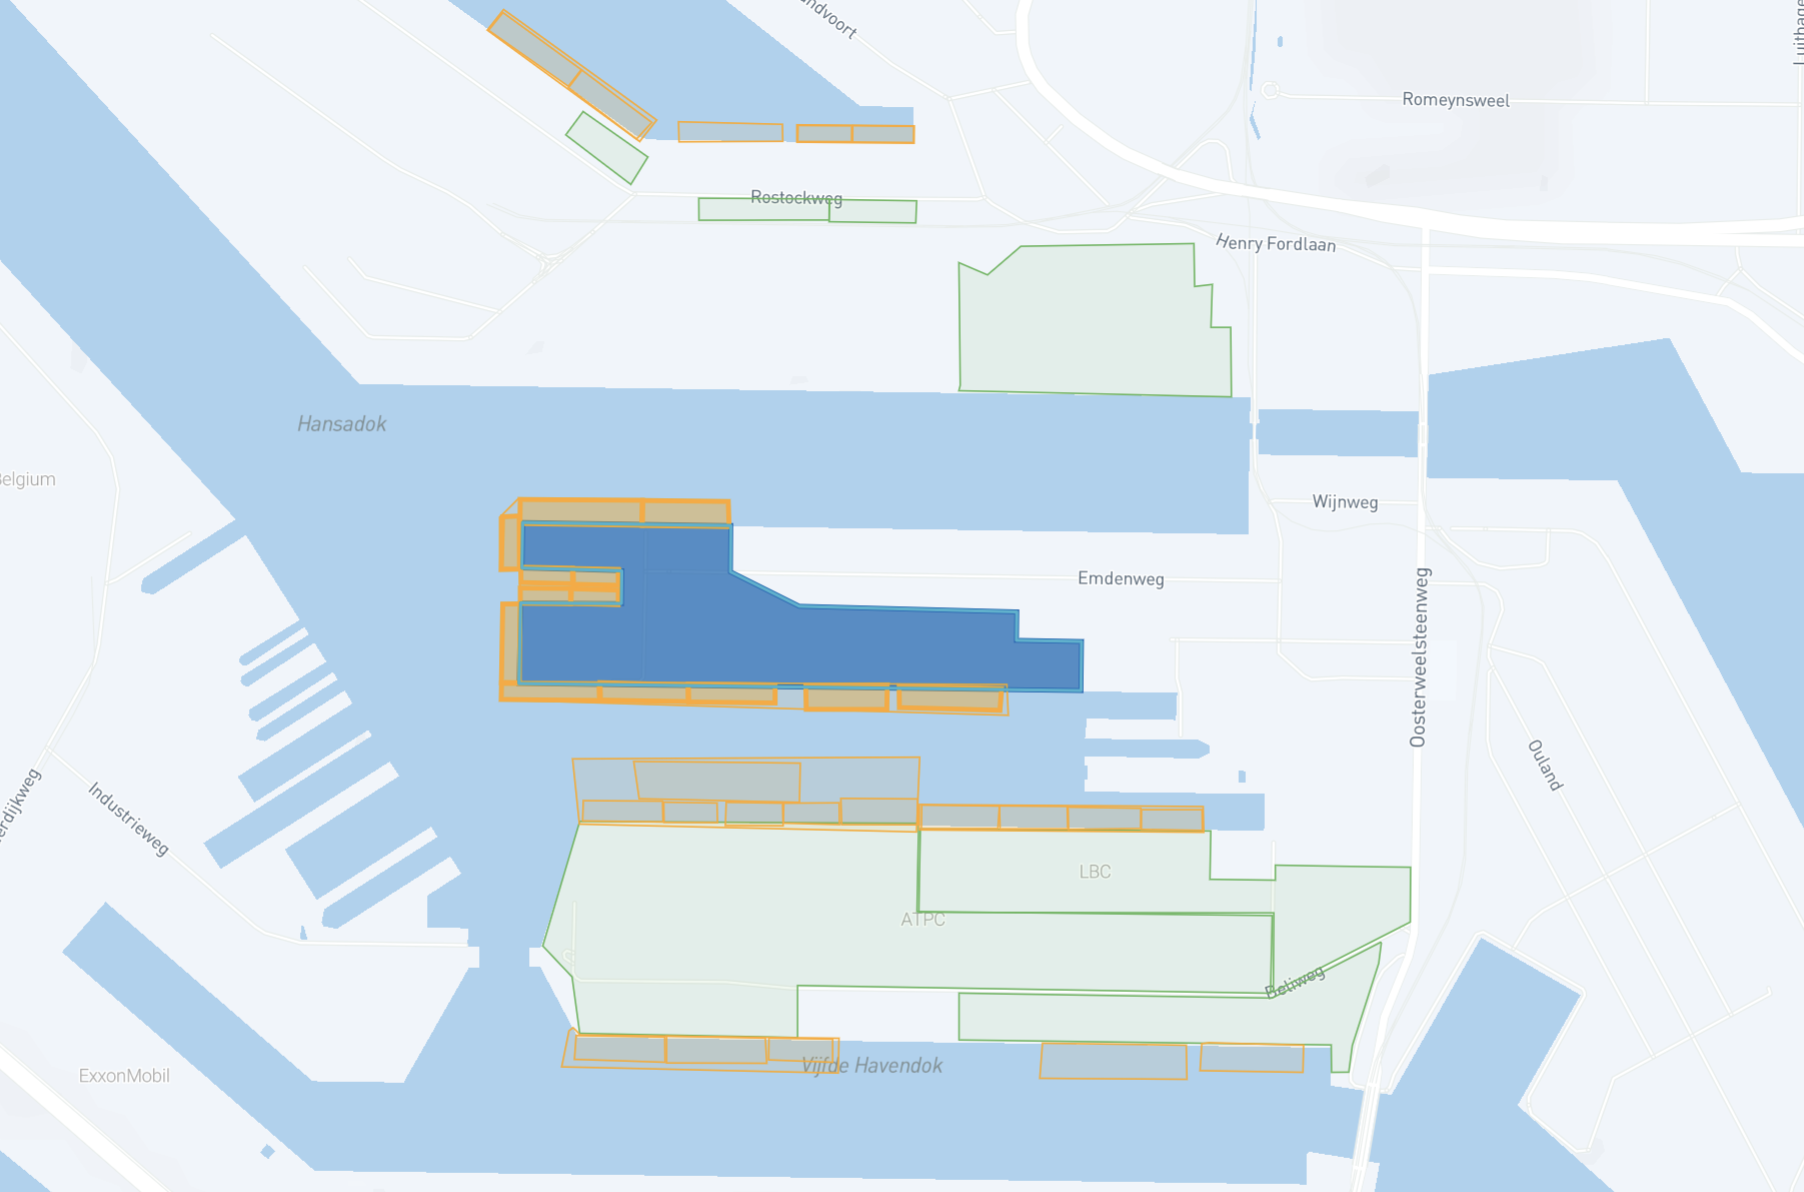
4) Differentiate storage or production facilities on 1 single map view
Stop guessing where a facility starts and ends, with our map location feature you will differentiate any terminal or production site from others right next door given that it highlights both the polygon area and the berths linked to each facility.
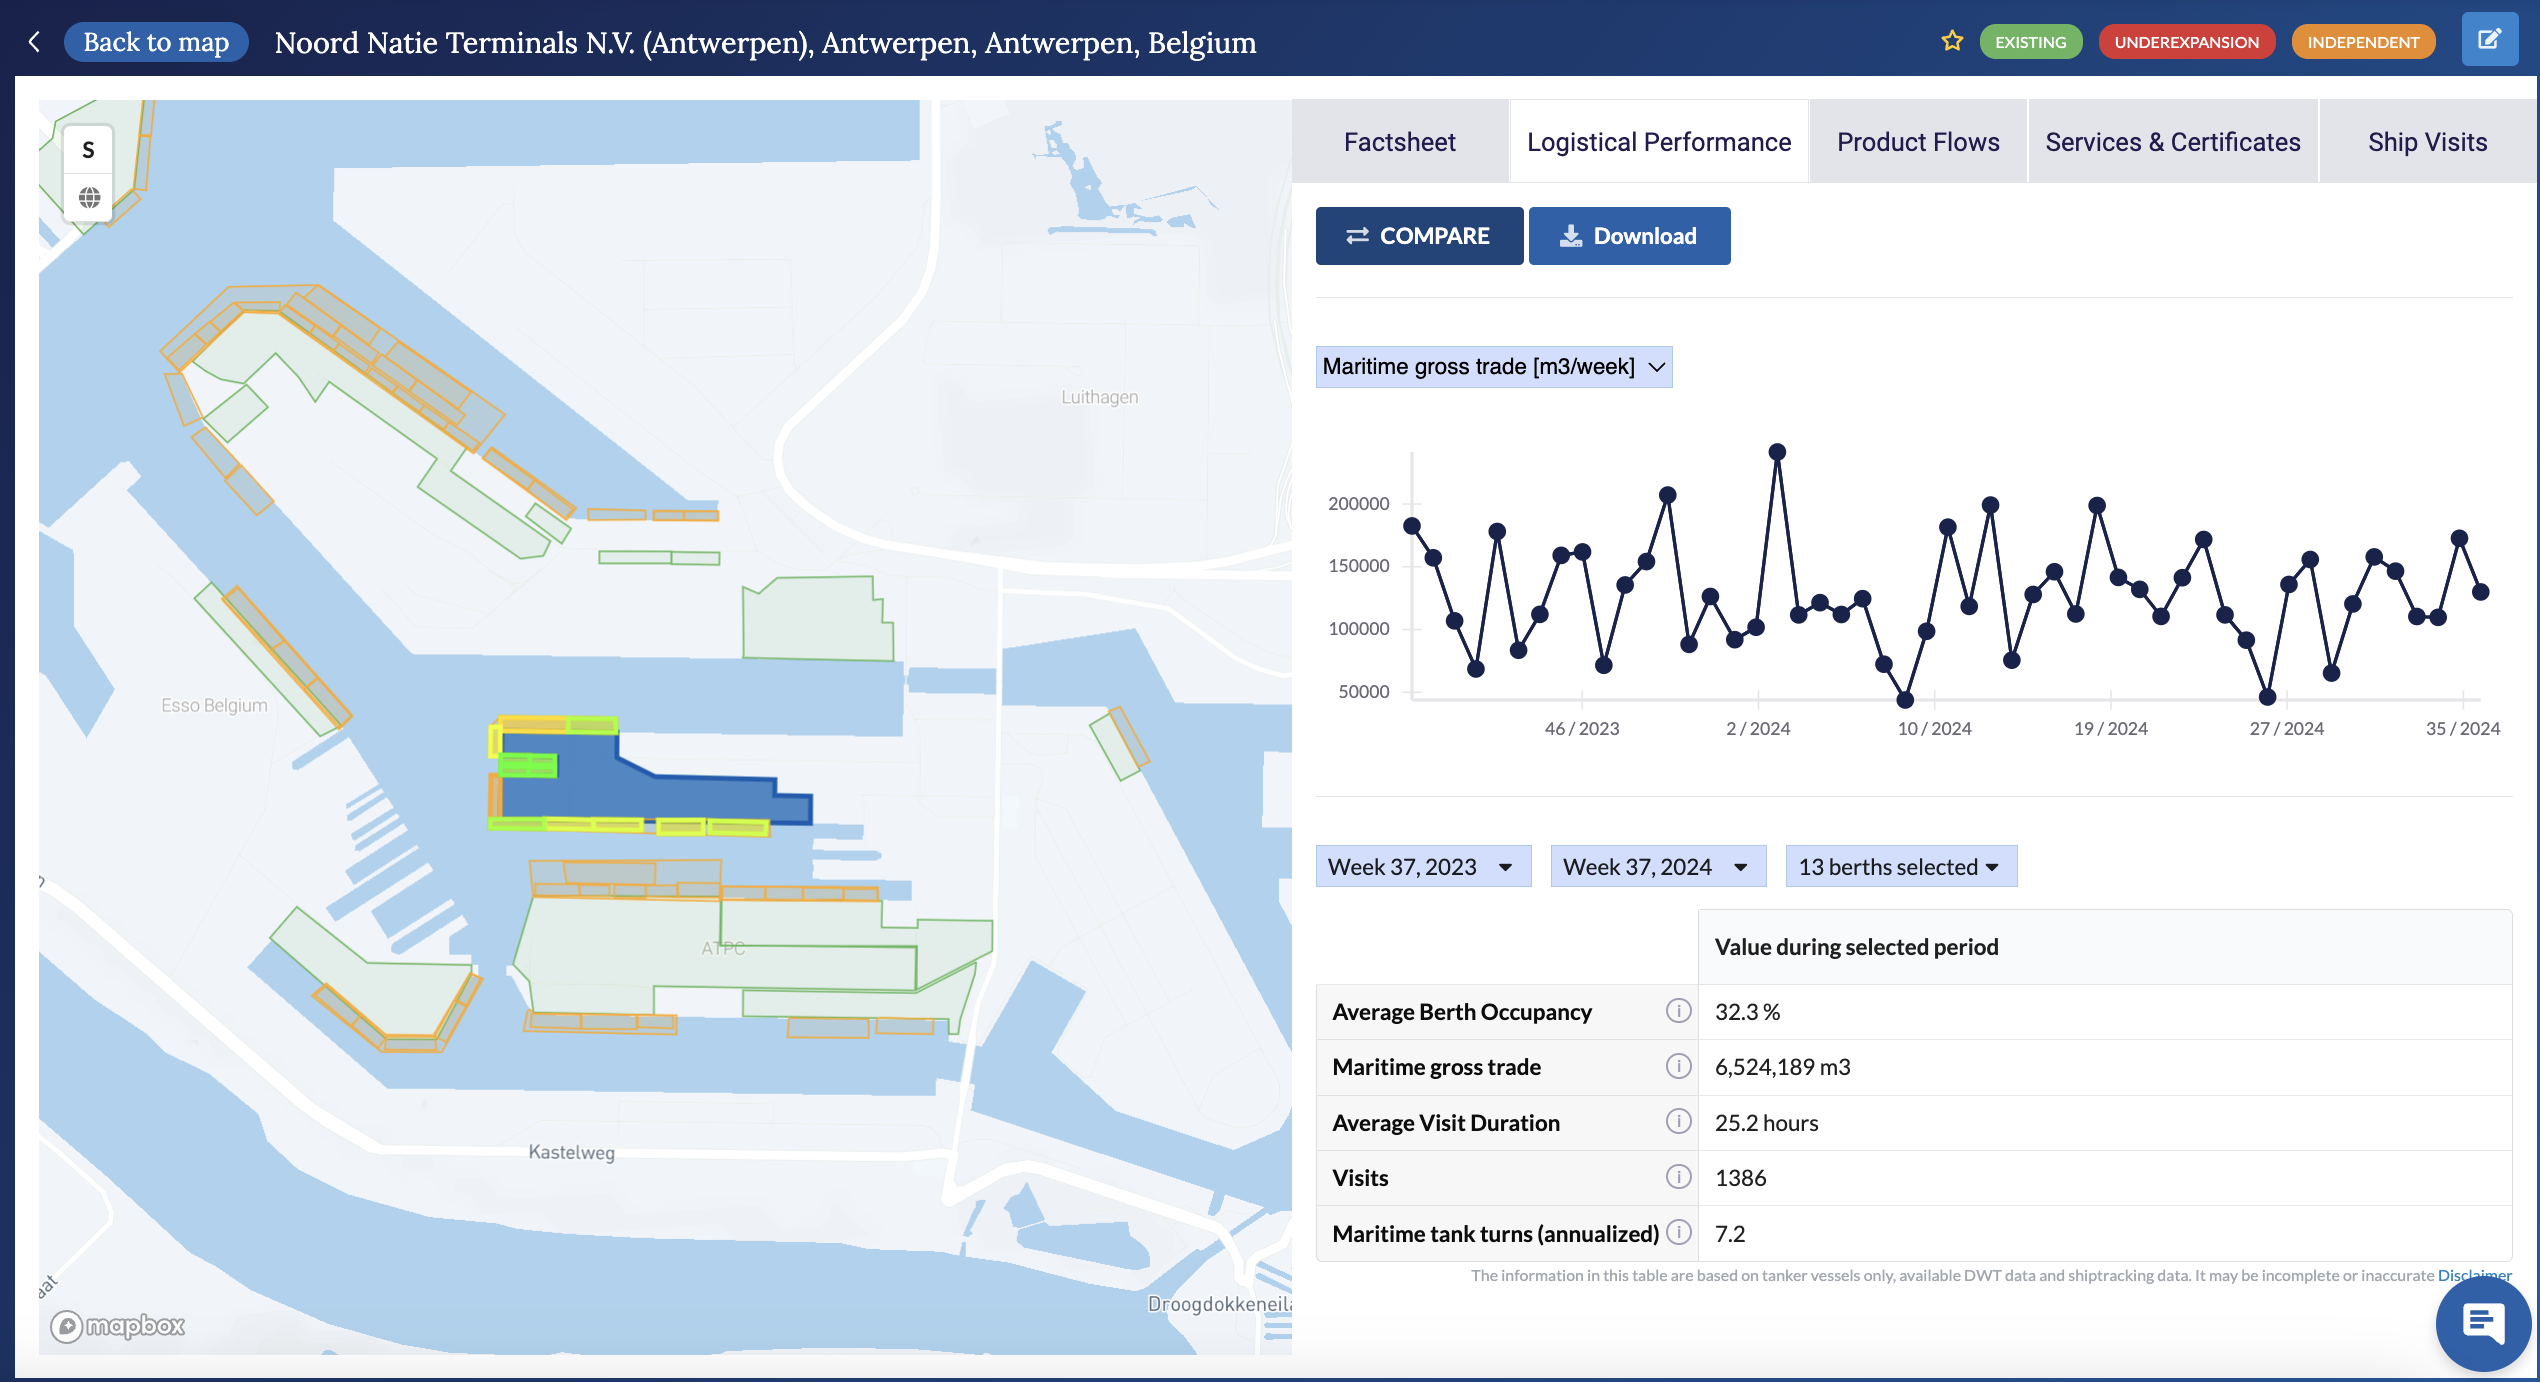
5) Terminals and refineries' logistical performance
Know the logistical performance of water-connected terminals & refineries based on average berth occupancy, maritime gross trade, average visit duration, ship visits, and annualized maritime tank turns, and therefore understand their operational efficiency.
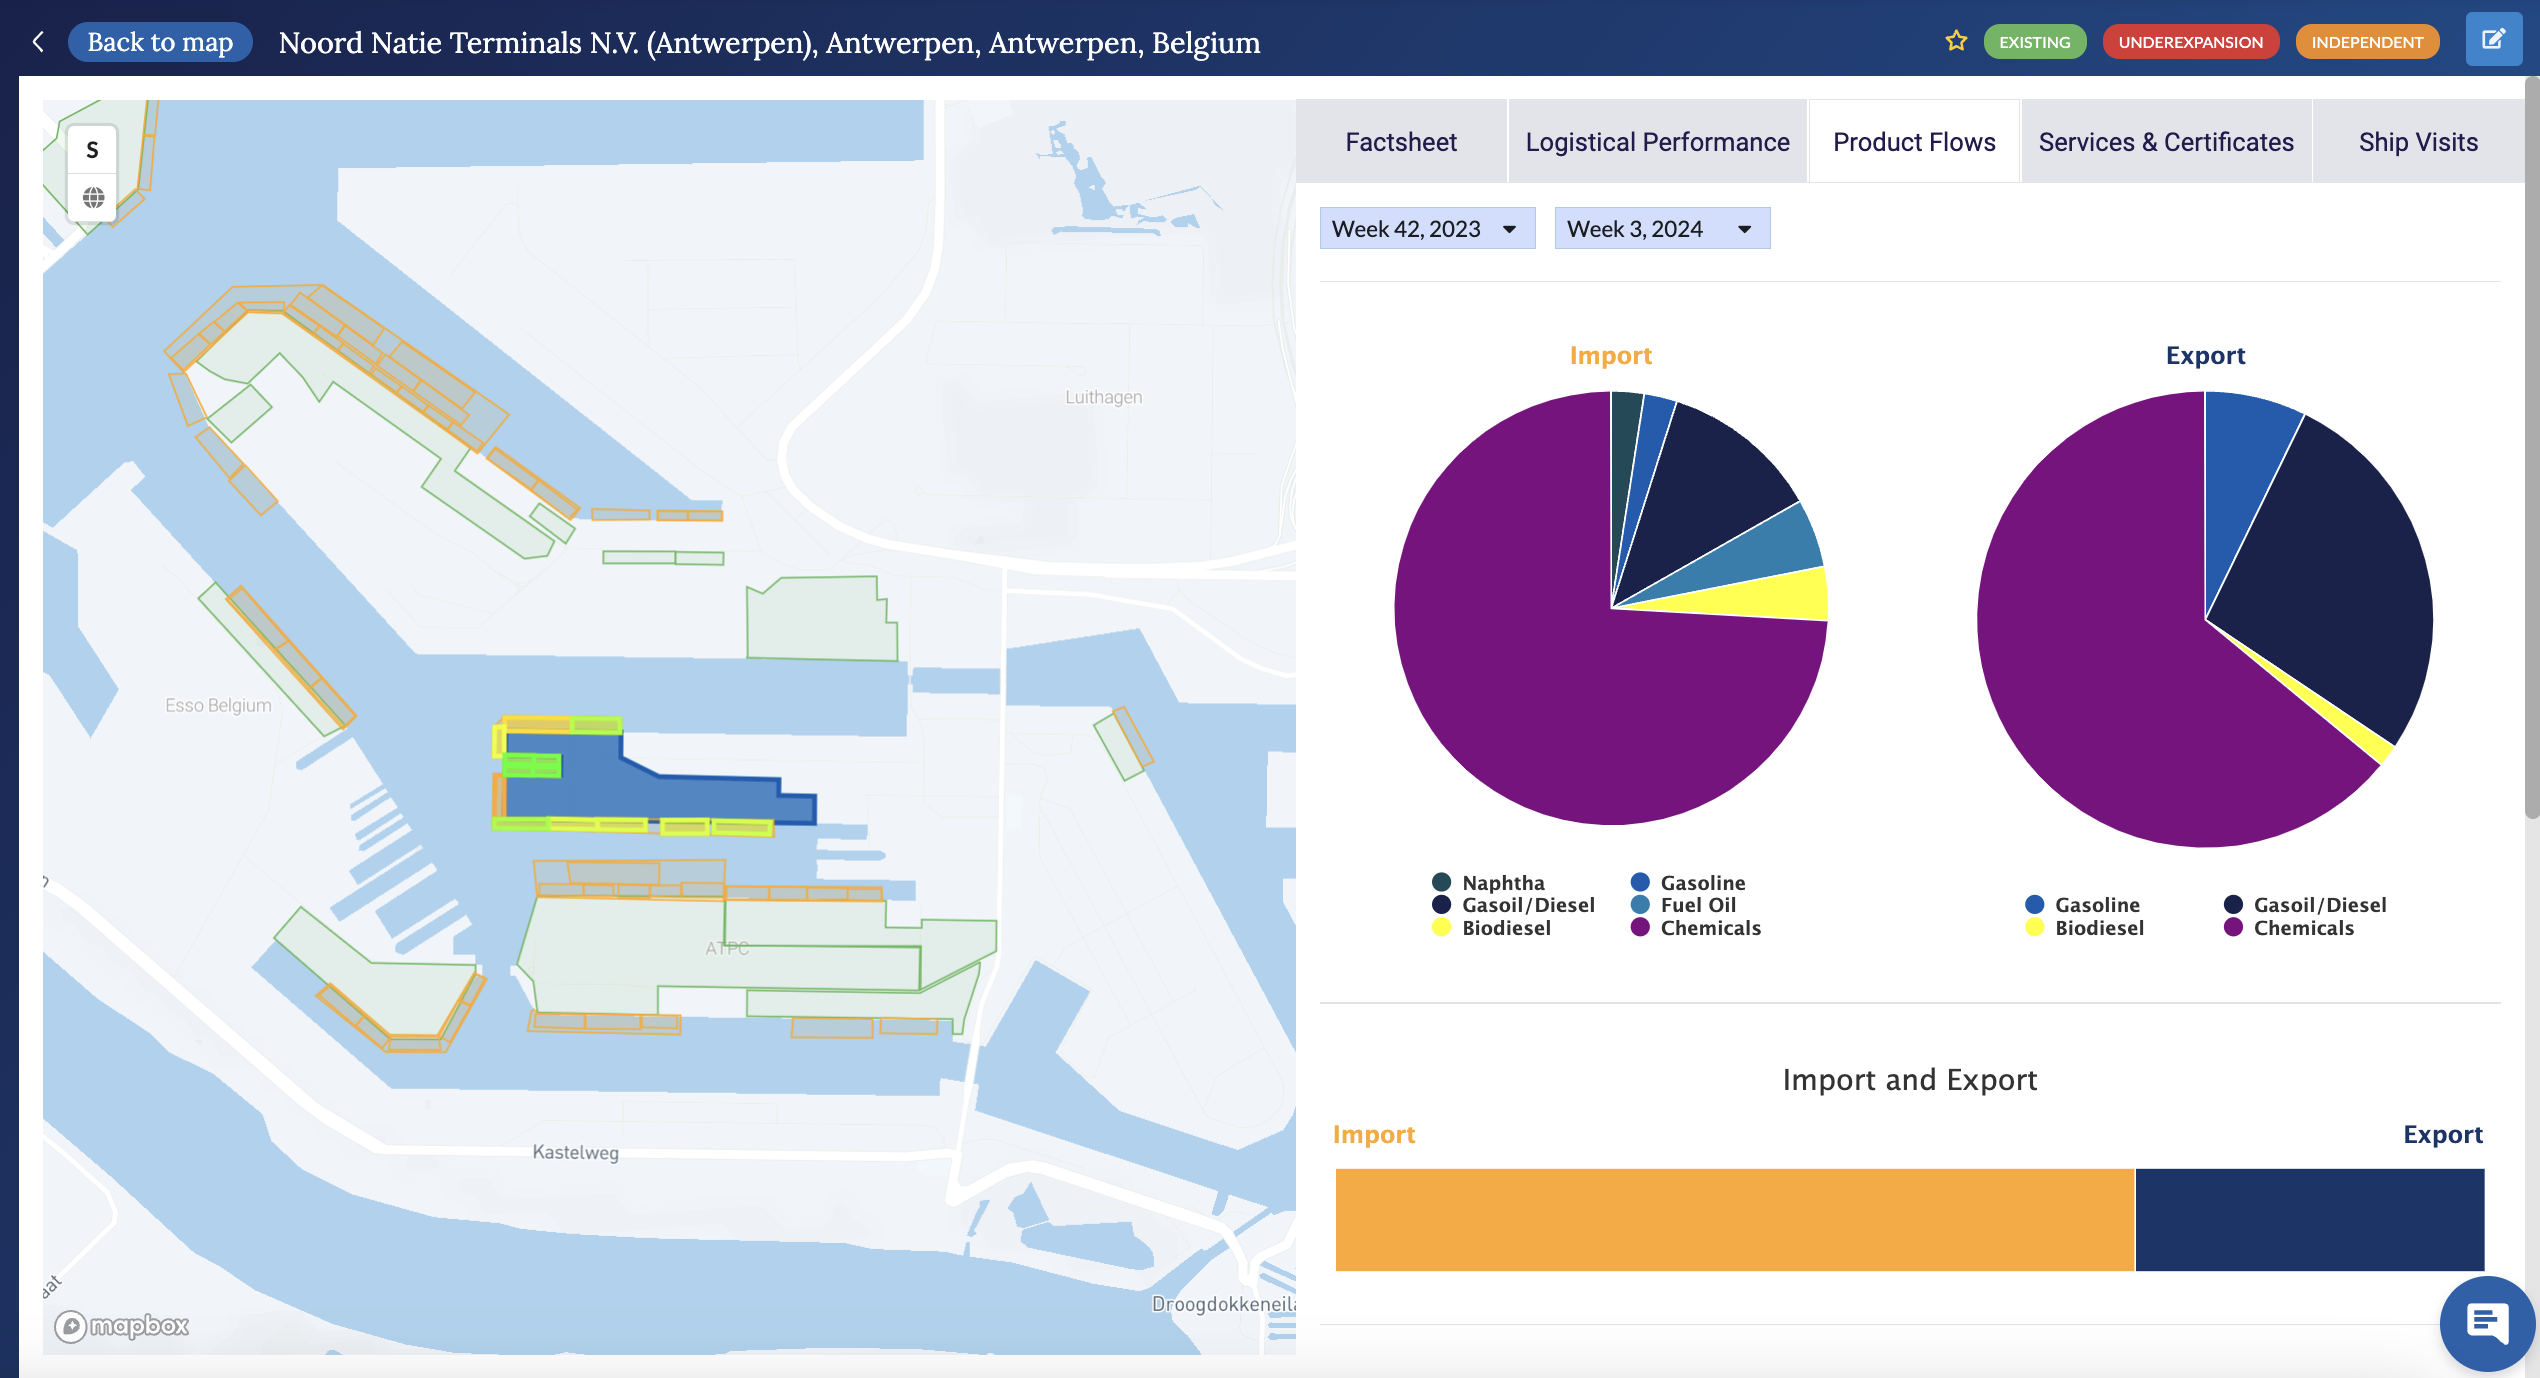
6) Terminals and refineries' product flows
Enhance your cargo flows analysis by knowing the tankers that visit refineries or terminals in a screen that shows previously visited facilities, arrival/departure times, and customizable date ranges of ship-related data that you can download.
6) Terminals and refineries' product flows
Enhance your cargo flows analysis by knowing the tankers that visit refineries or terminals in a screen that shows previously visited facilities, arrival/departure times, and customizable date ranges of ship-related data that you can download.
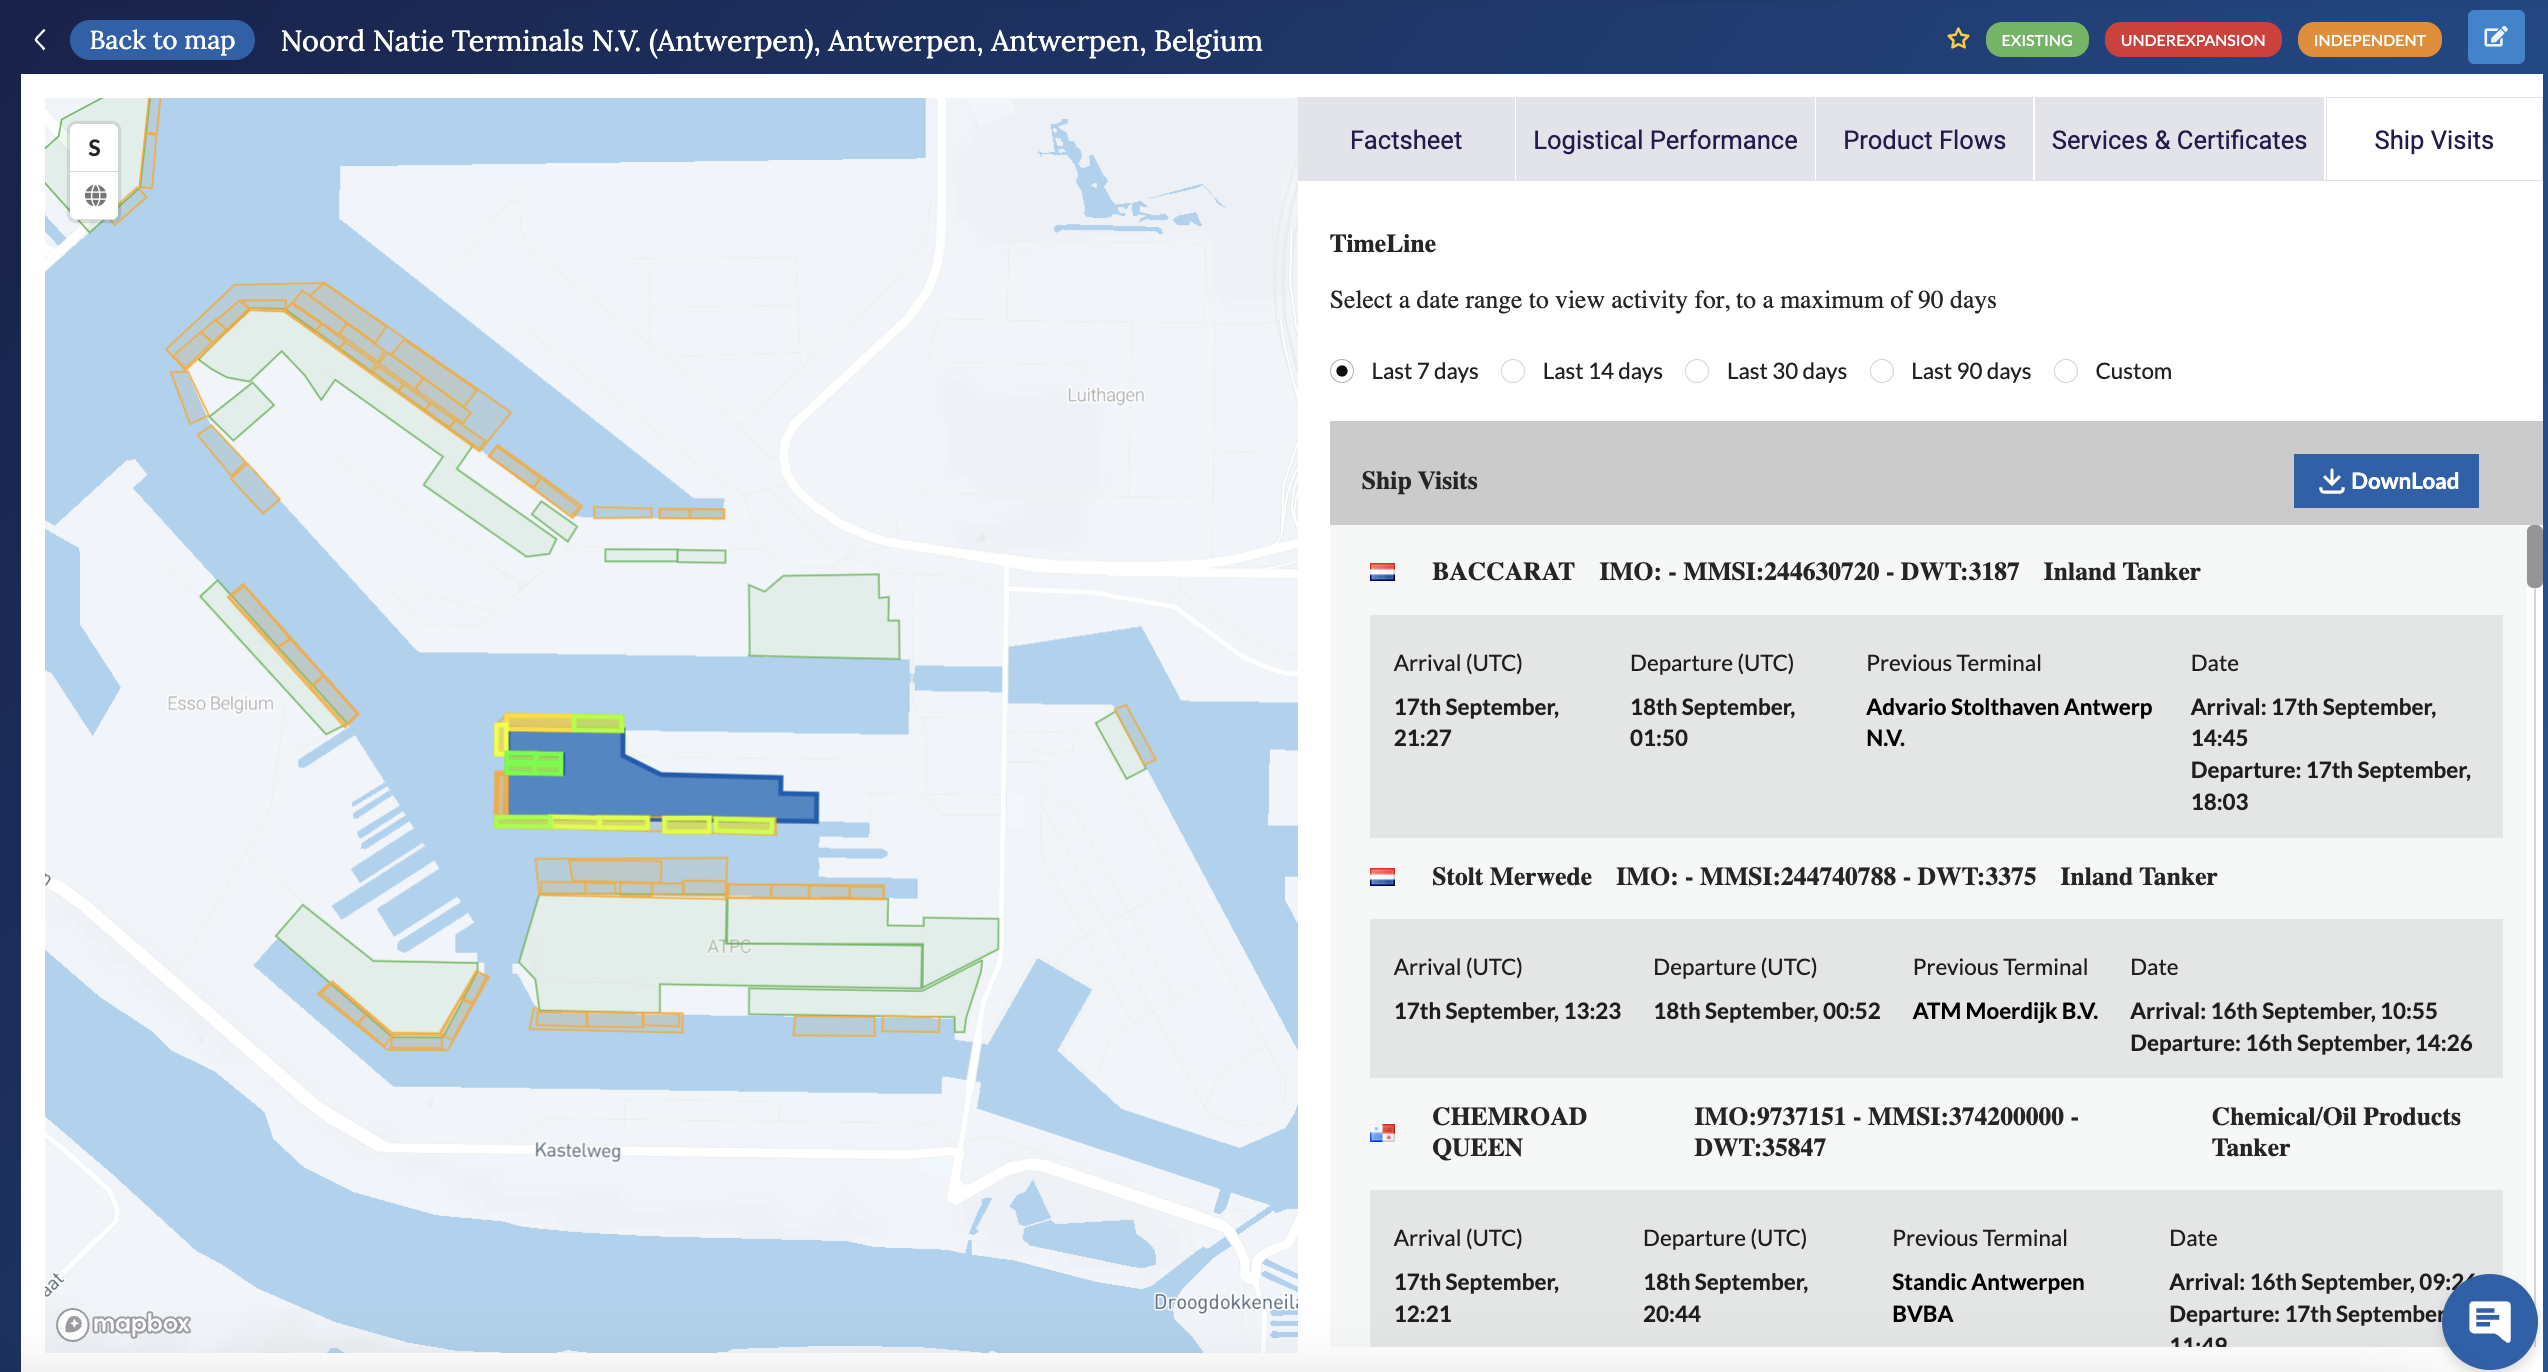
7) Ship visits to terminals & refineries
Enhance your cargo flows analysis by knowing the tankers that visit refineries or terminals in a screen that shows previously visited facilities, arrival/departure times, and customizable date ranges of ship-related data that you can download.
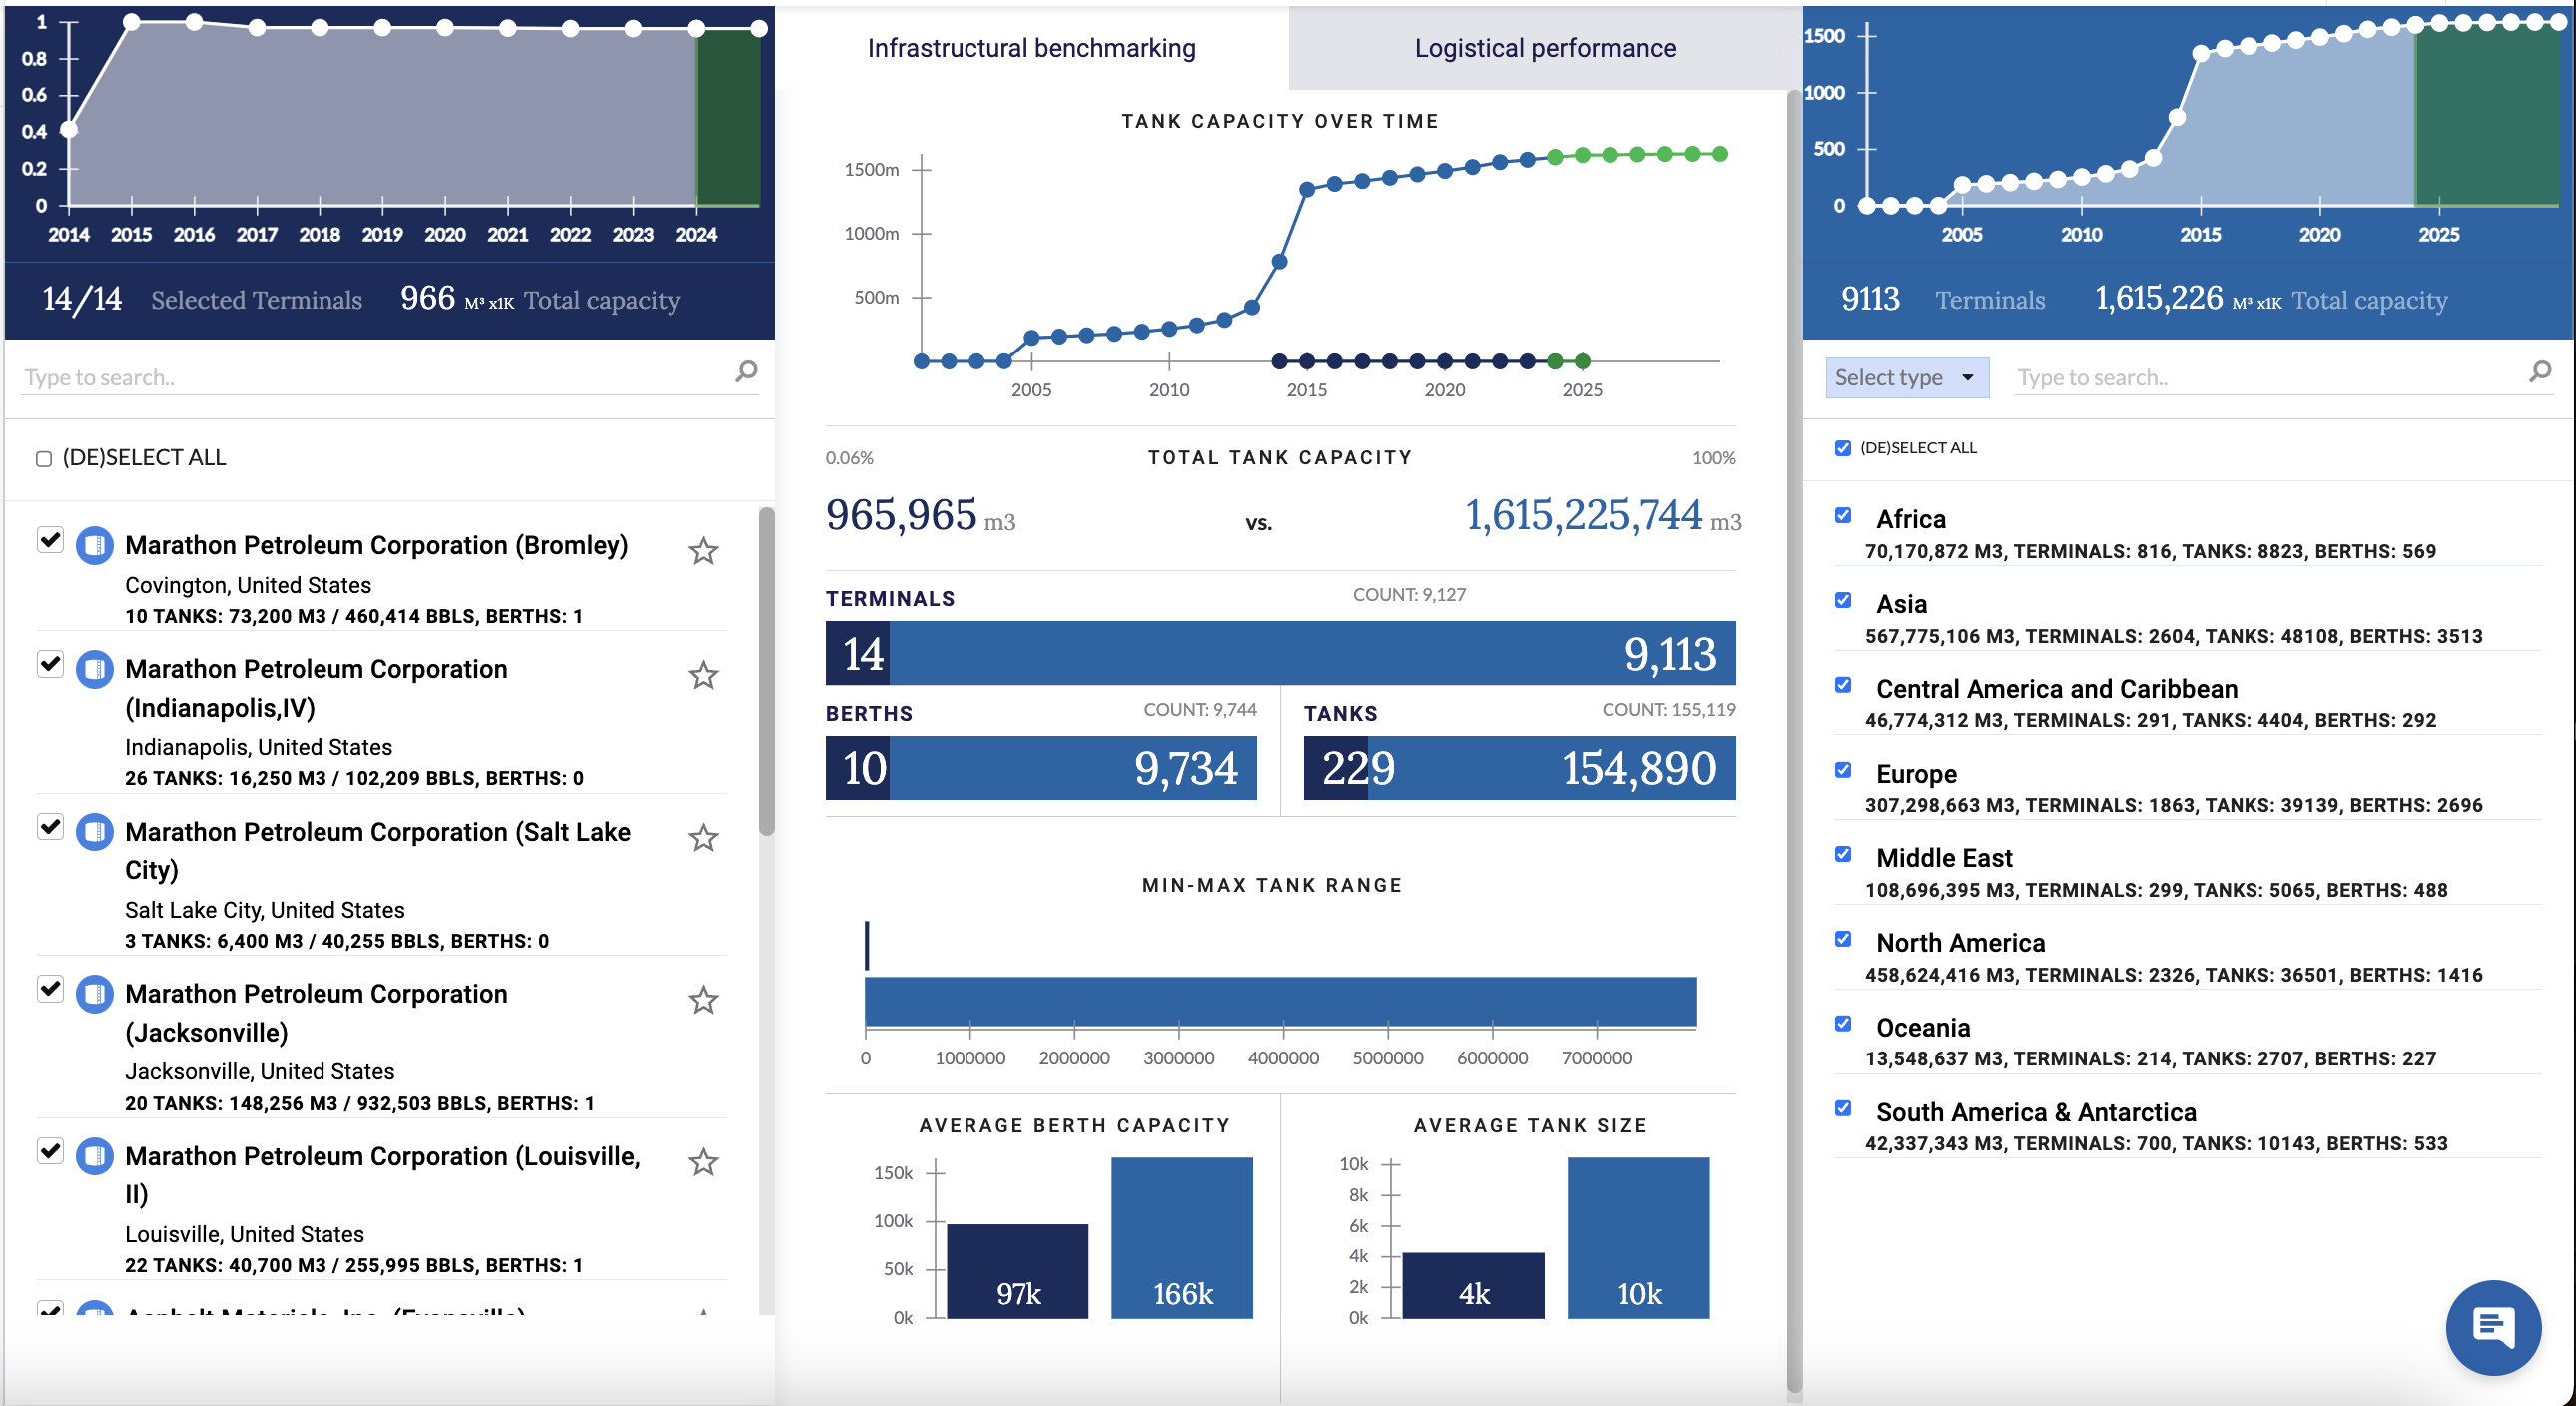
8) Benchmark tank terminals' infrastructural characteristics
Compare storage capacity, avg tank size, avg berth capacity, number of terminals, tanks and berths between terminals, ports, regions, countries or your own collections with data displayed not only on one single screen but also with graphs to differentiate each data set.
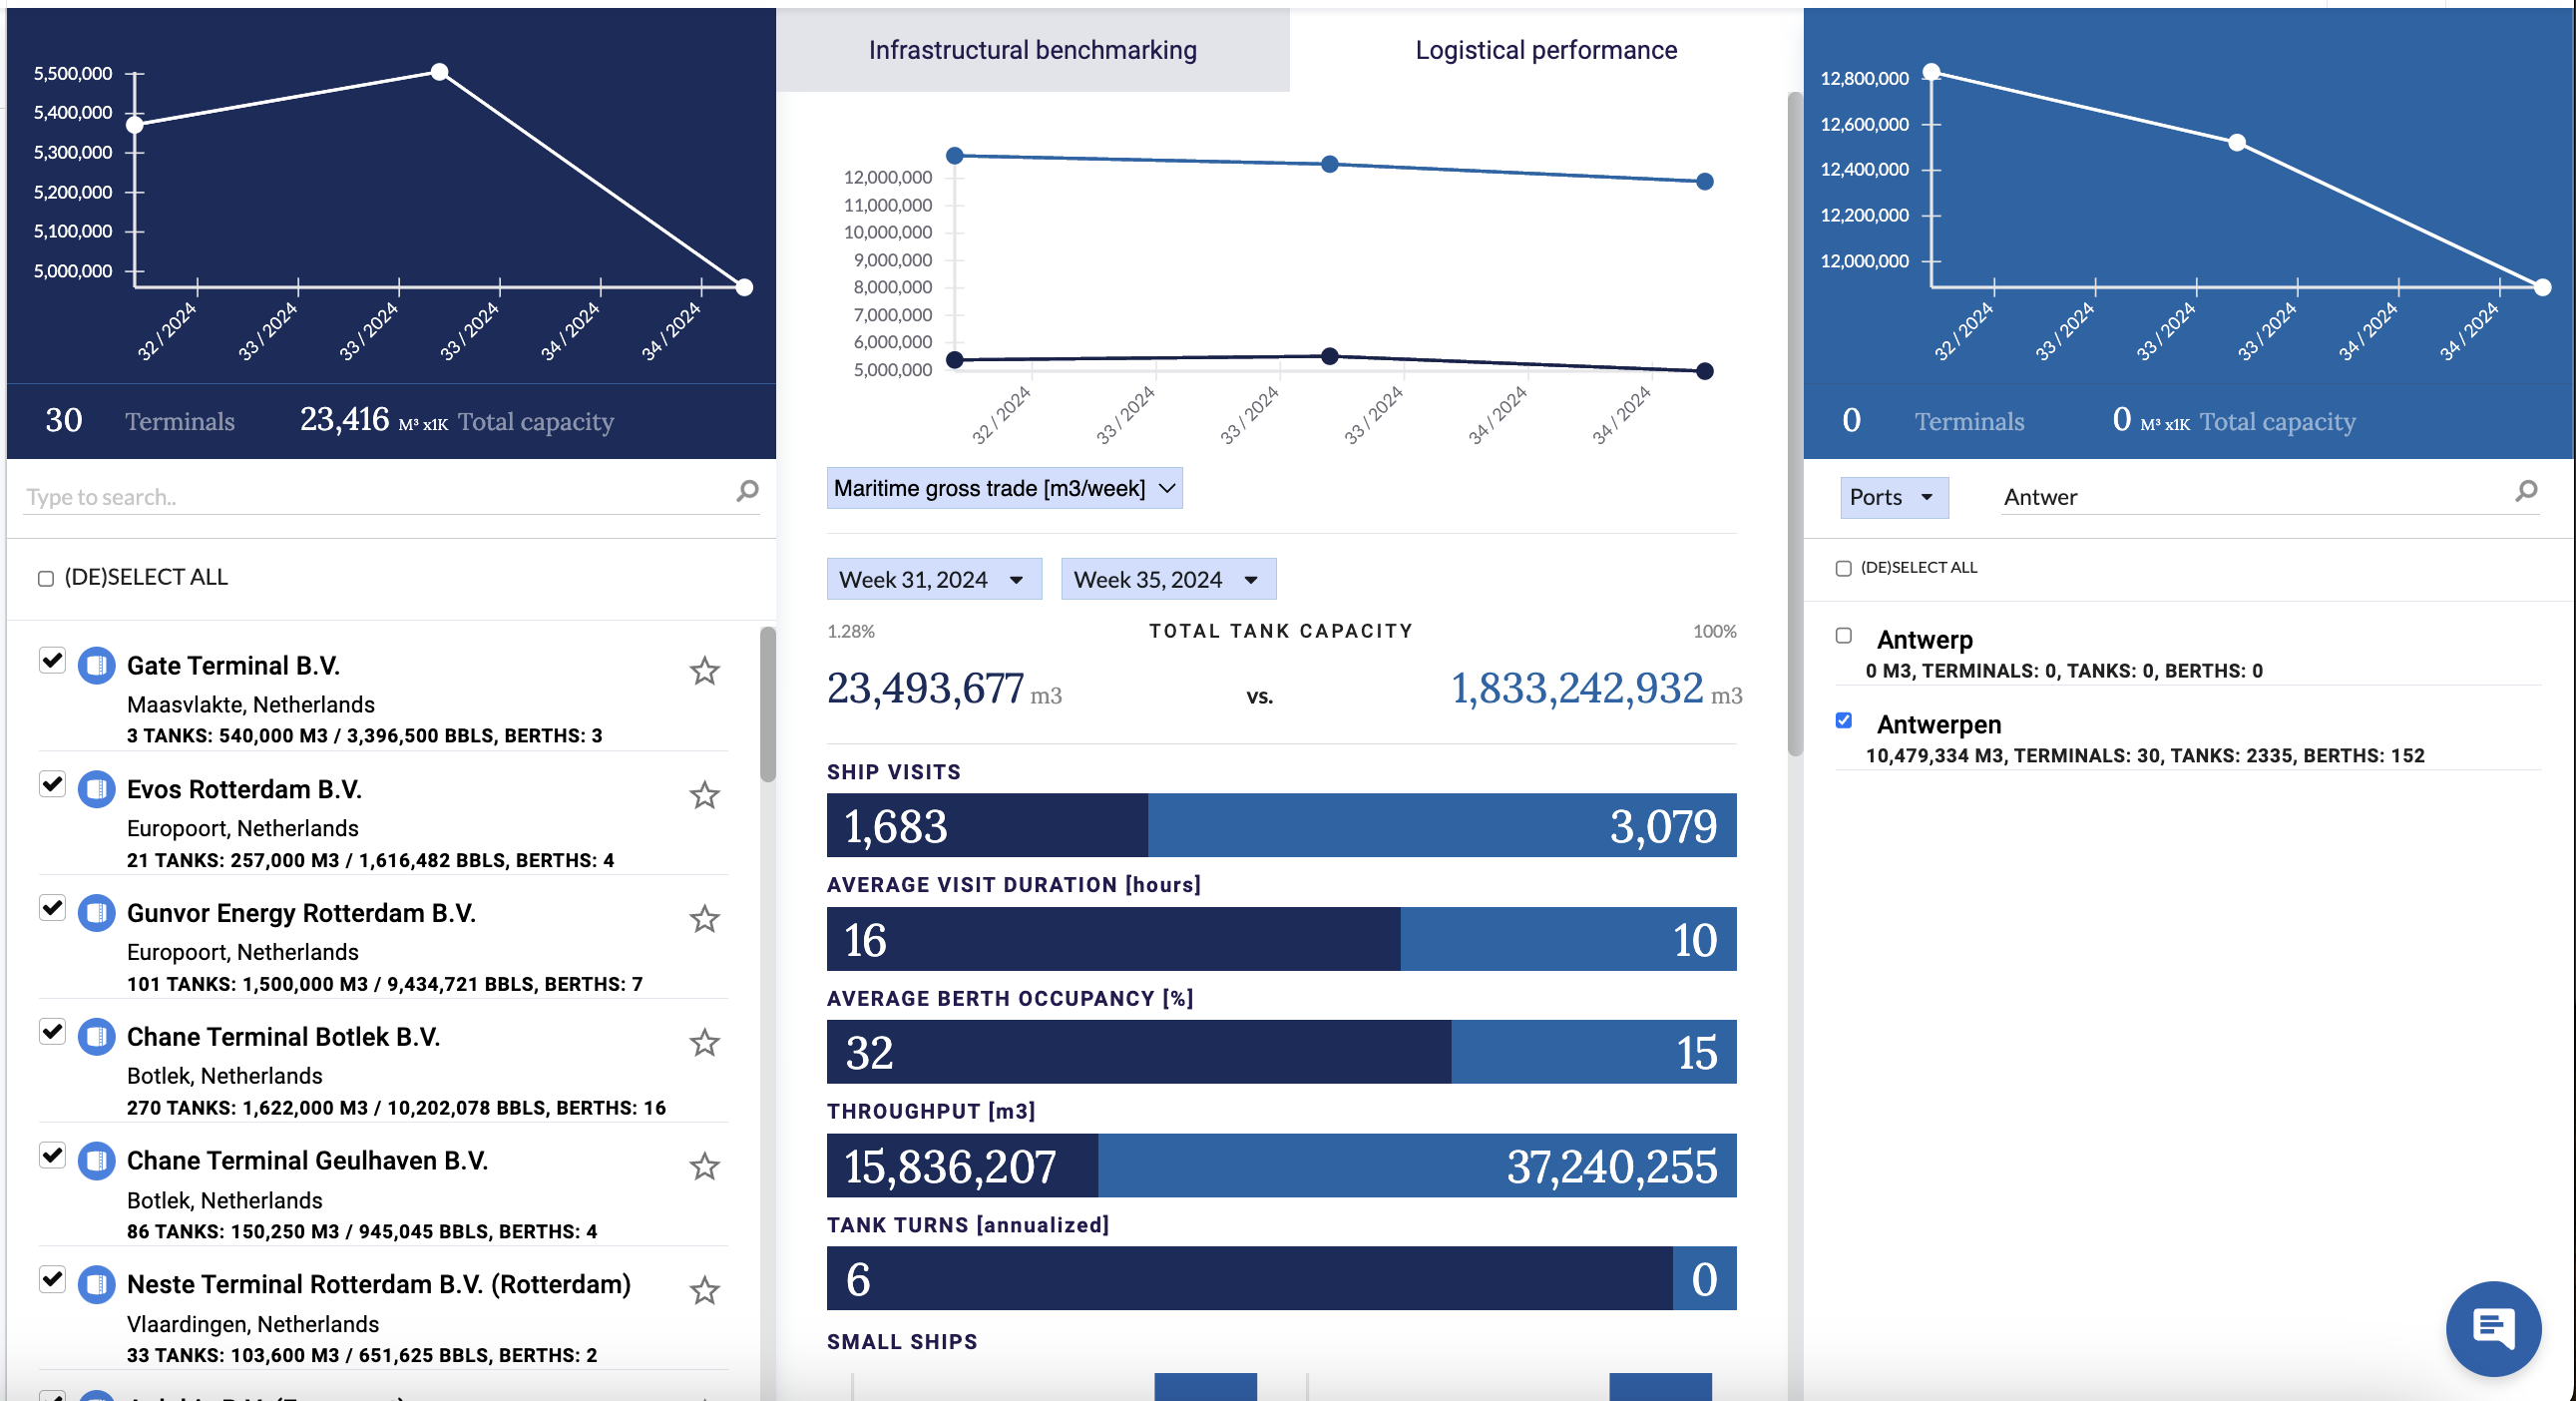
9) Benchmark tank terminals' key performance indicators
Select a group of terminals, ports, regions, countries or your own collections and compare them based on a customizable time frame that shows maritime gross trade, ship visits, average visit duration, average berth occupancy, throughput, and tank turns, and ship-type visits.
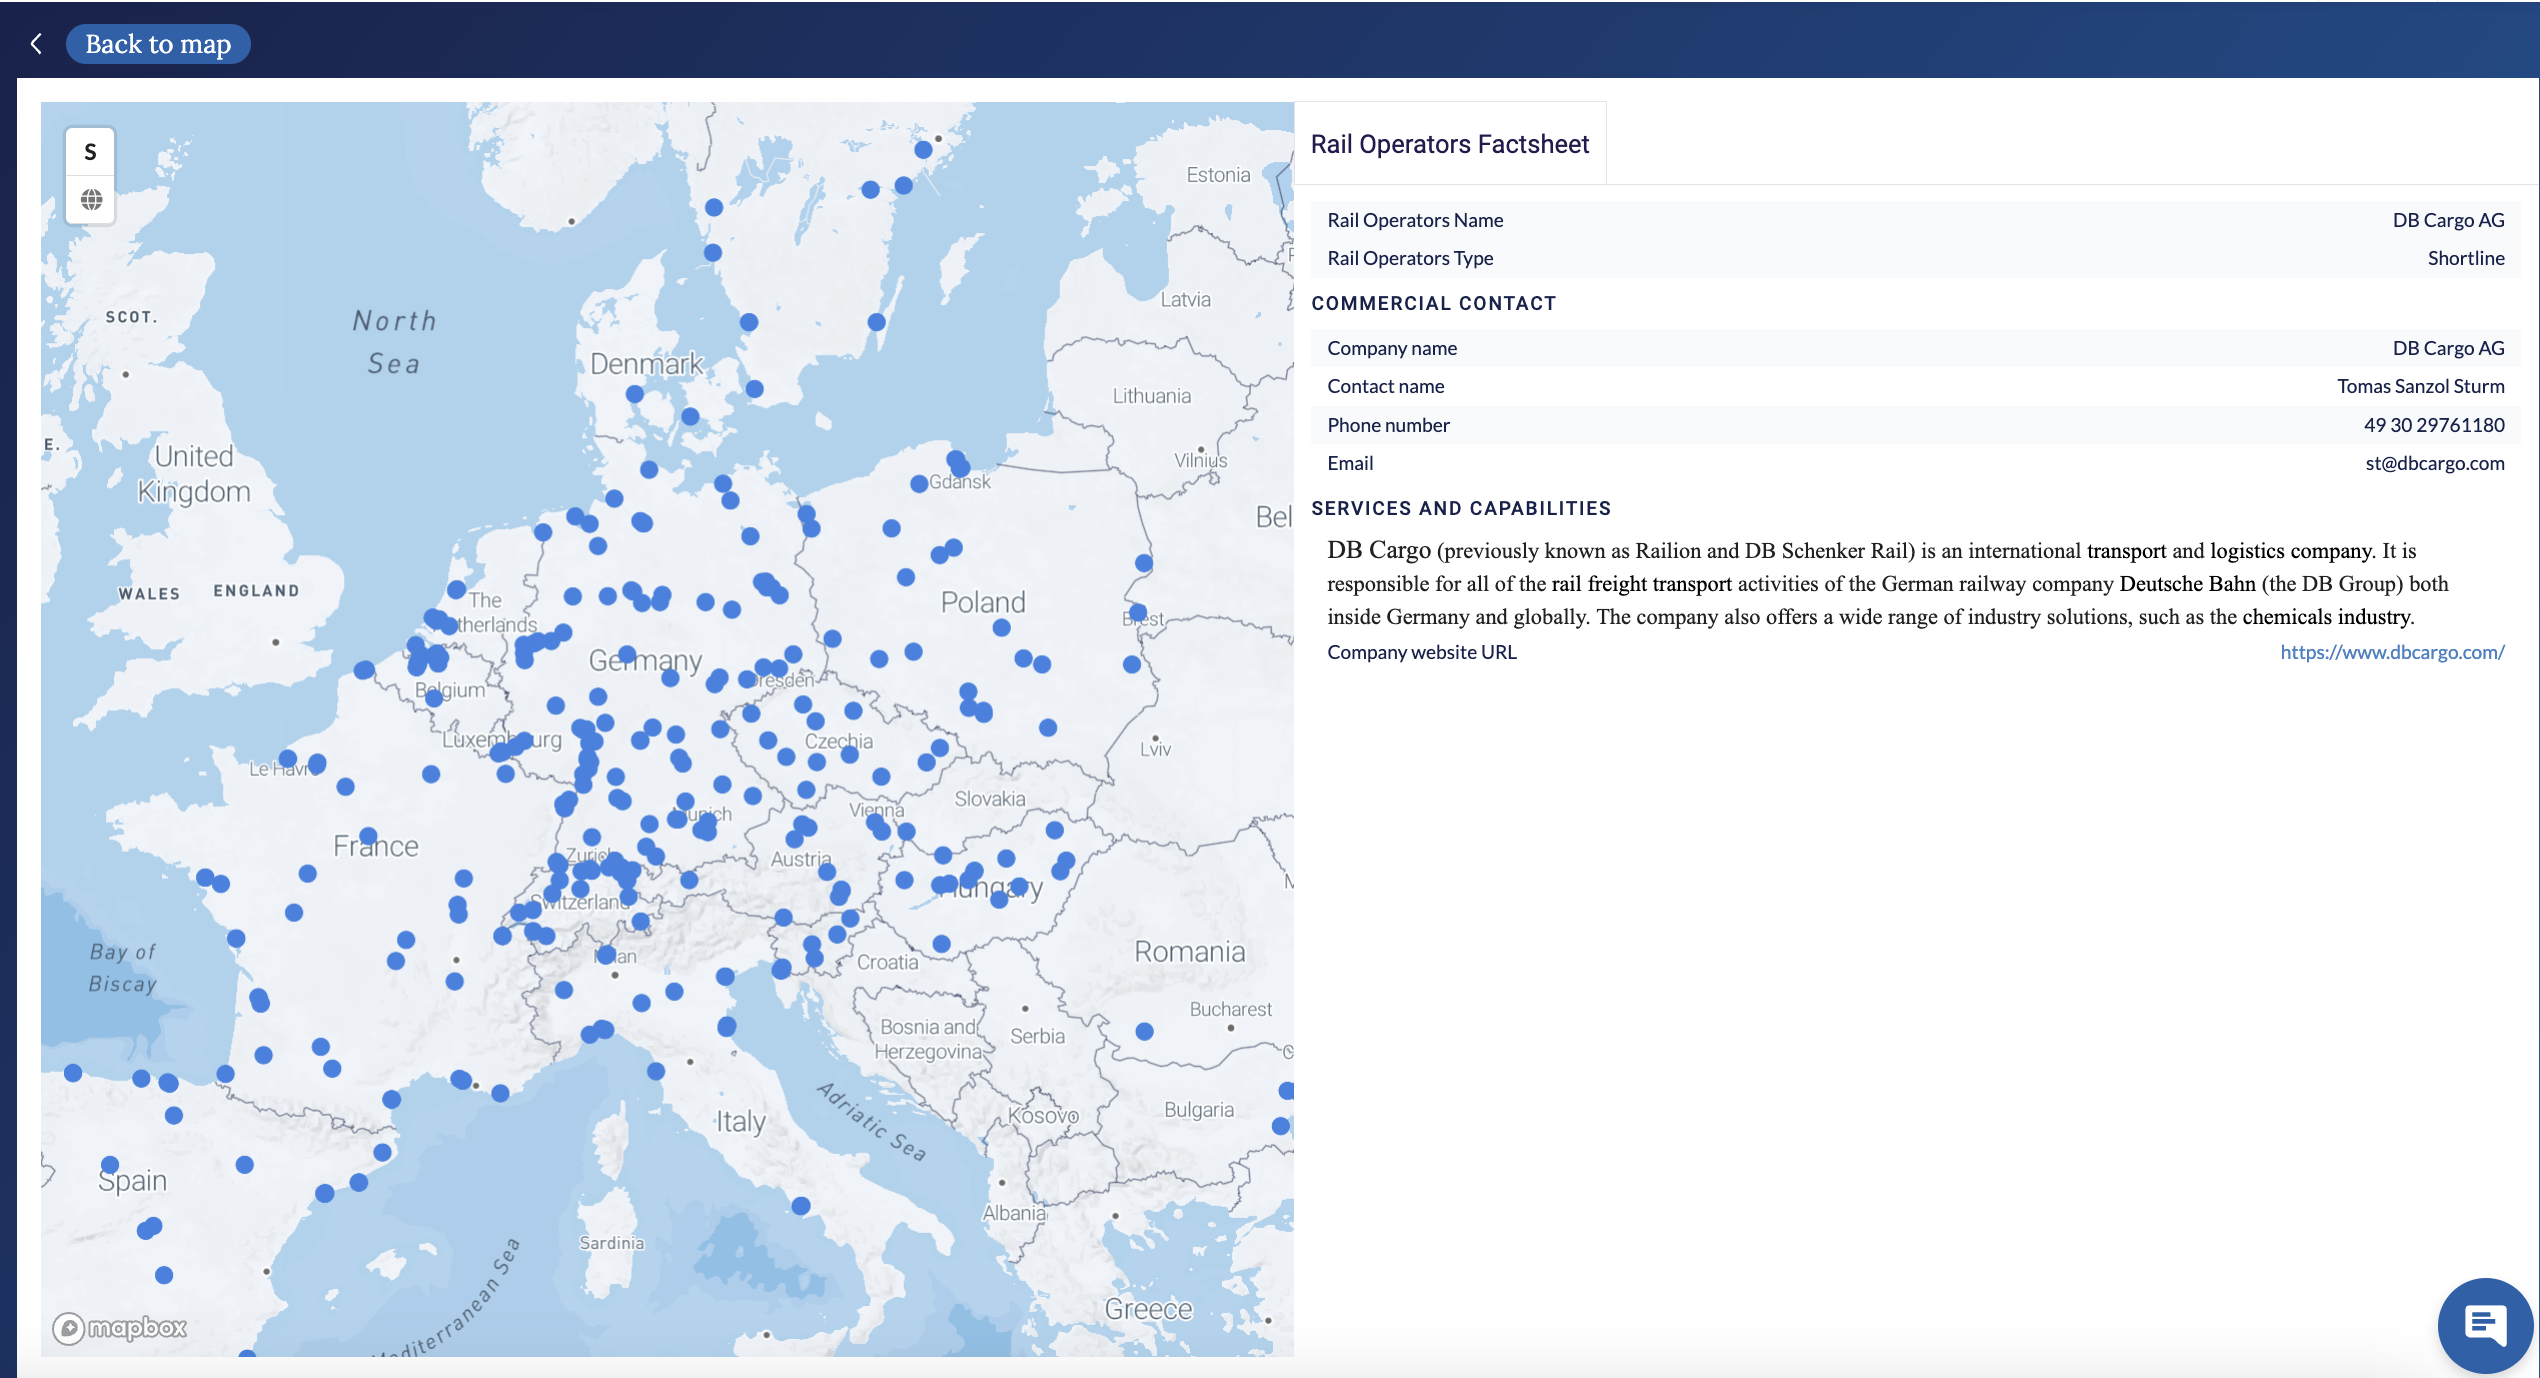
10) Pipeline, Truck & Rail Companies
Develop an ‘insider supply chain’ proficiency by not only knowing the pipeline companies, trucks and rails operators connected to each terminal and refinery, but also the regions in which those companies are actively servicing other supply chains.
10) Pipeline, Truck & Rail Companies
Develop an ‘insider supply chain’ proficiency by not only knowing the pipeline companies, trucks and rails operators connected to each terminal and refinery, but also the regions in which those companies are actively servicing other supply chains.
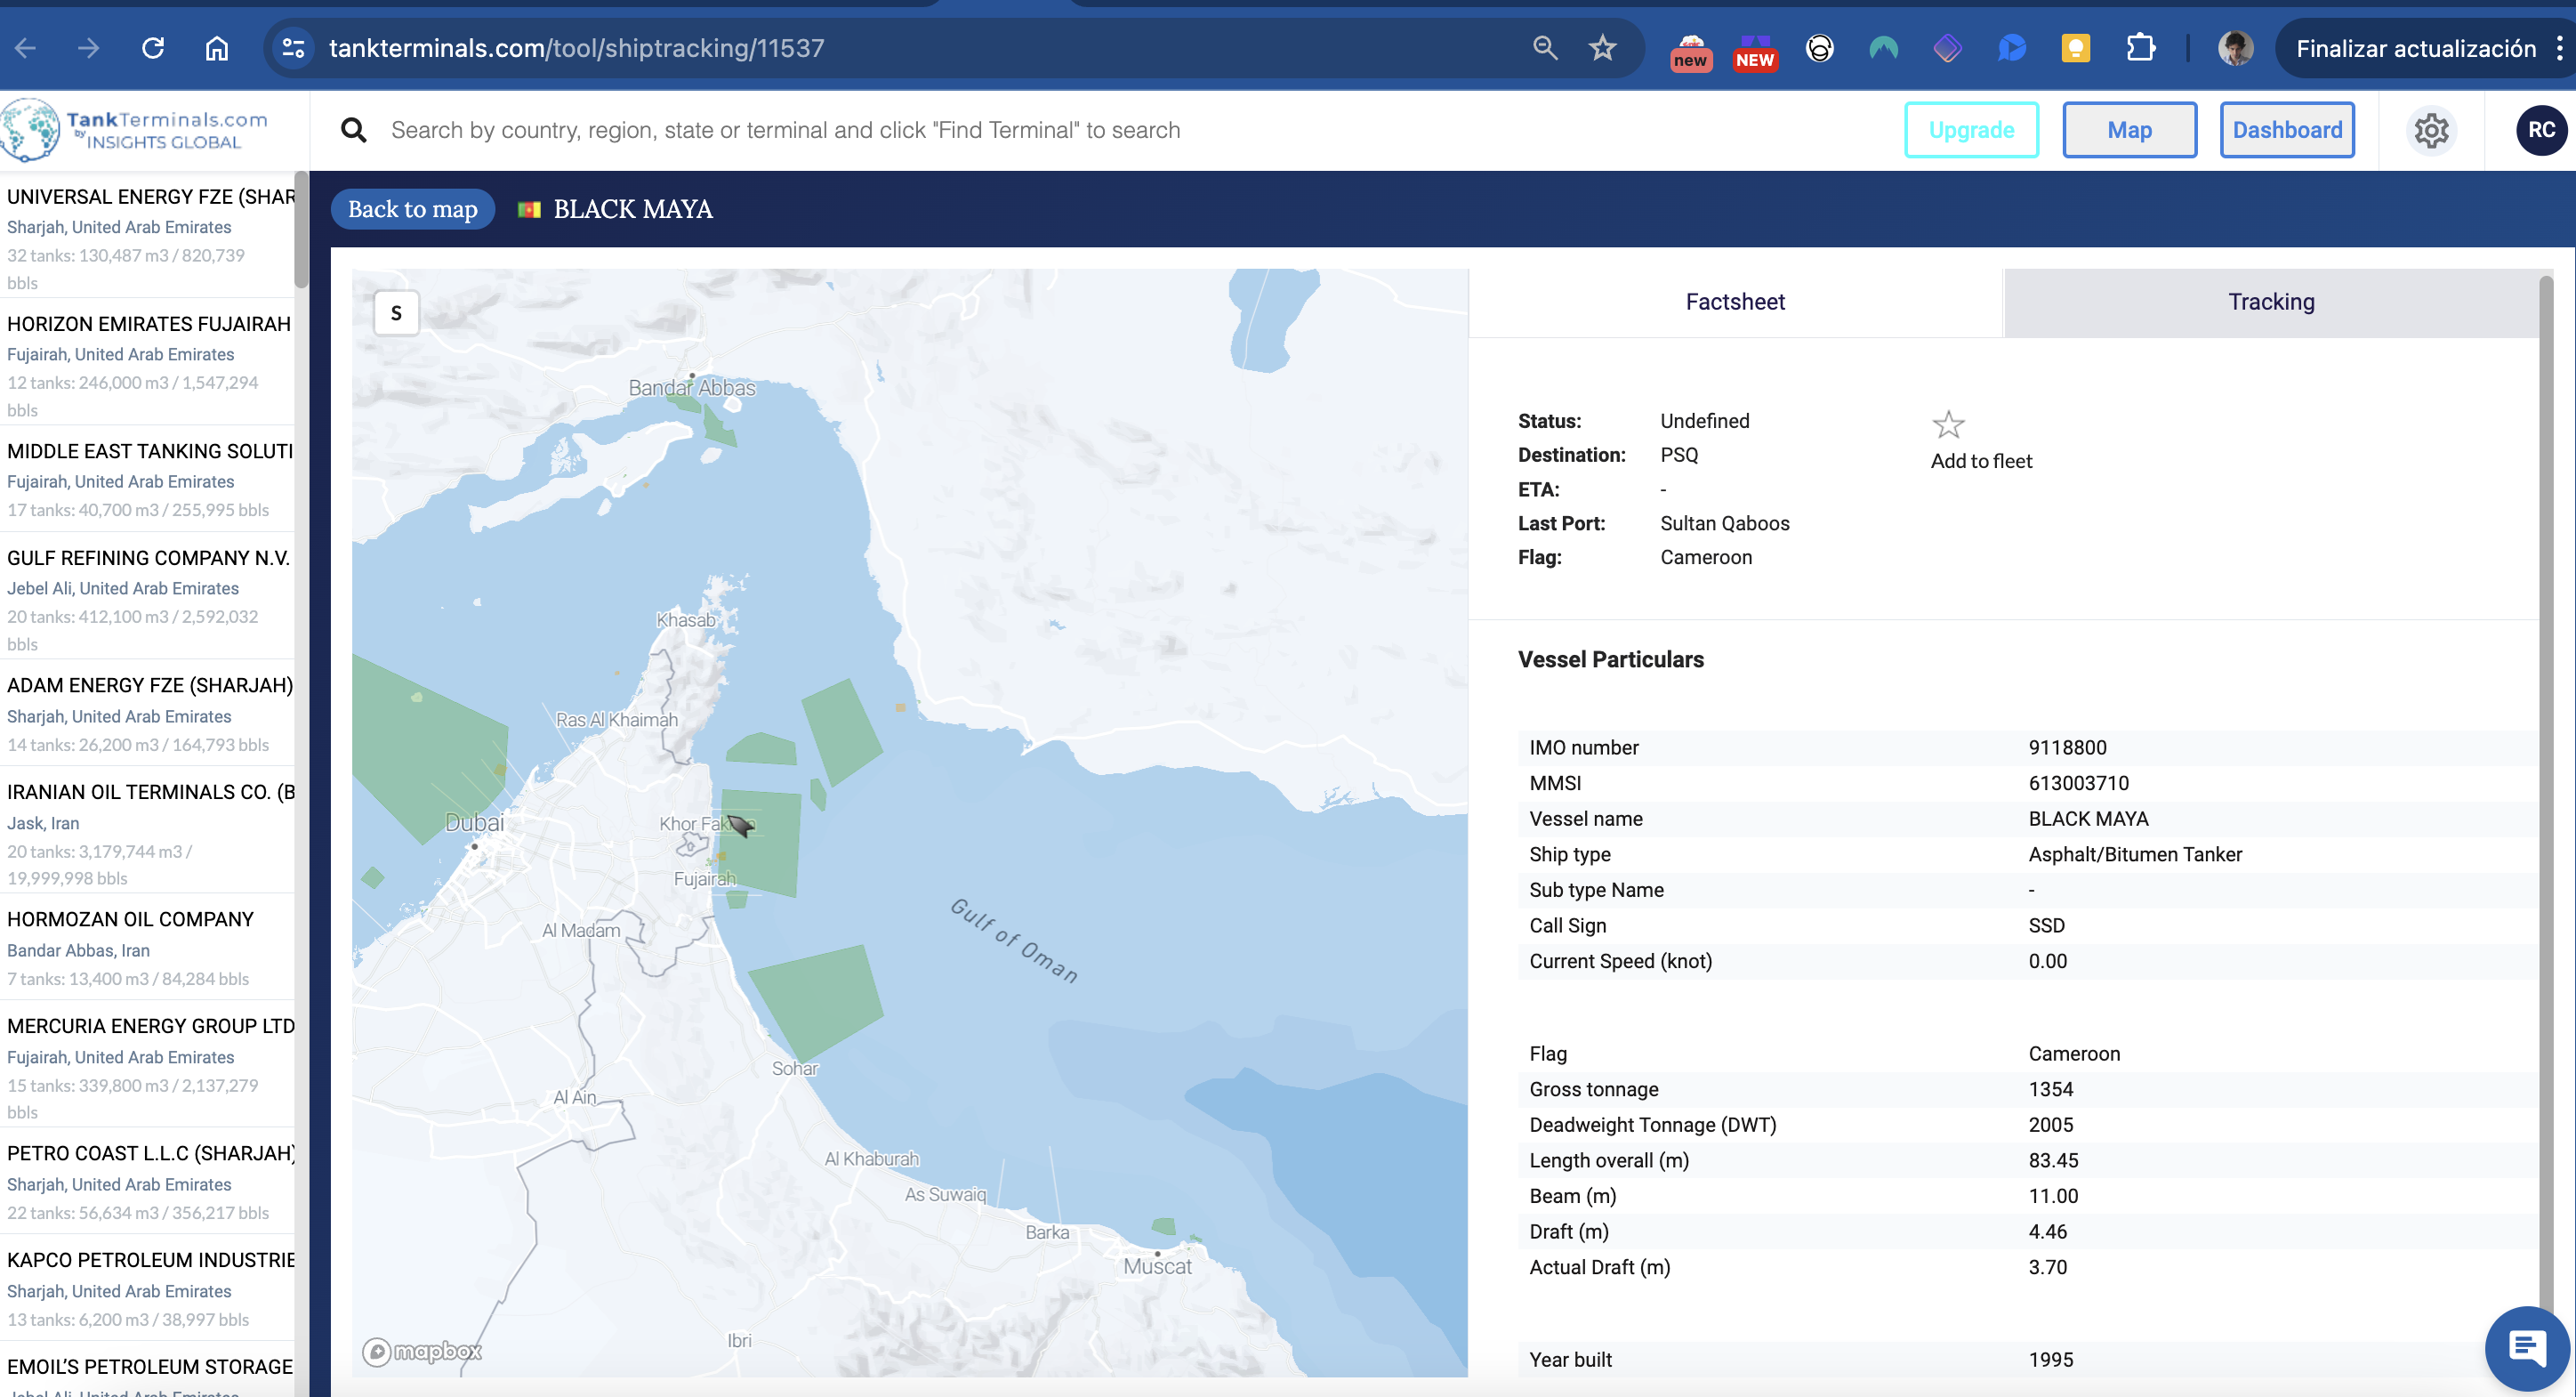
11) Tanker factsheets (characteristics)
Know vessels’ status, destination, last port, gross tonnage, DWT, length, beam, draft, visited facilities and vessel type such as: crude oil, liquified gas, chemical/oil products, asphalt/bitumen tanker, FSO/FPSO, bunker, inland.
12) Tanker Tracking (visited terminals & refineries)
Know the marine or river-connected facilities visited by bulk liquid carrier vessels, which you can filter by up to 27 types (crude oil, liquified gas, chemical/oil products, asphalt/bitumen tanker, FSO/FPSO, bunker, inland).
12) Tanker Tracking (visited terminals & refineries)
Know the marine or river-connected facilities visited by bulk liquid carrier vessels, which you can filter by up to 27 types (crude oil, liquified gas, chemical/oil products, asphalt/bitumen tanker, FSO/FPSO, bunker, inland).
13) Real-time tracking of tankers
Always know the exact location of any tanker thanks to “Fleet Mode”, which allows you to spot any ship in seconds, saving you search-time in a screen view clustered with hundreds of other tankers.